<?xml version="1.0" encoding="utf-8"?>
<feed xmlns="http://www.w3.org/2005/Atom" xmlns:media="http://search.yahoo.com/mrss/">
    <title>claritech.io</title>
    <link href="https://www.claritech.io/feed.xml" rel="self" />
    <link href="https://www.claritech.io" />
    <updated>2026-09-28T15:02:43-07:00</updated>
    <author>
        <name>claritech.io</name>
    </author>
    <id>https://www.claritech.io</id>

    <entry>
        <title>The Case for a Network Infrastructure Data Strategy: 9 Things That Change With Better Data Planning</title>
        <author>
            <name>Jon Baars</name>
        </author>
        <link href="https://www.claritech.io/the-case-for-a-network-infrastructure-data-strategy-9-things-that-change-with-better-data-planning/"/>
        <id>https://www.claritech.io/the-case-for-a-network-infrastructure-data-strategy-9-things-that-change-with-better-data-planning/</id>
        <media:content url="https://www.claritech.io/media/posts/45/cell-site.jpg" medium="image" />
            <category term="All Articles"/>

        <updated>2026-06-25T08:35:43-07:00</updated>
            <summary type="html">
                <![CDATA[
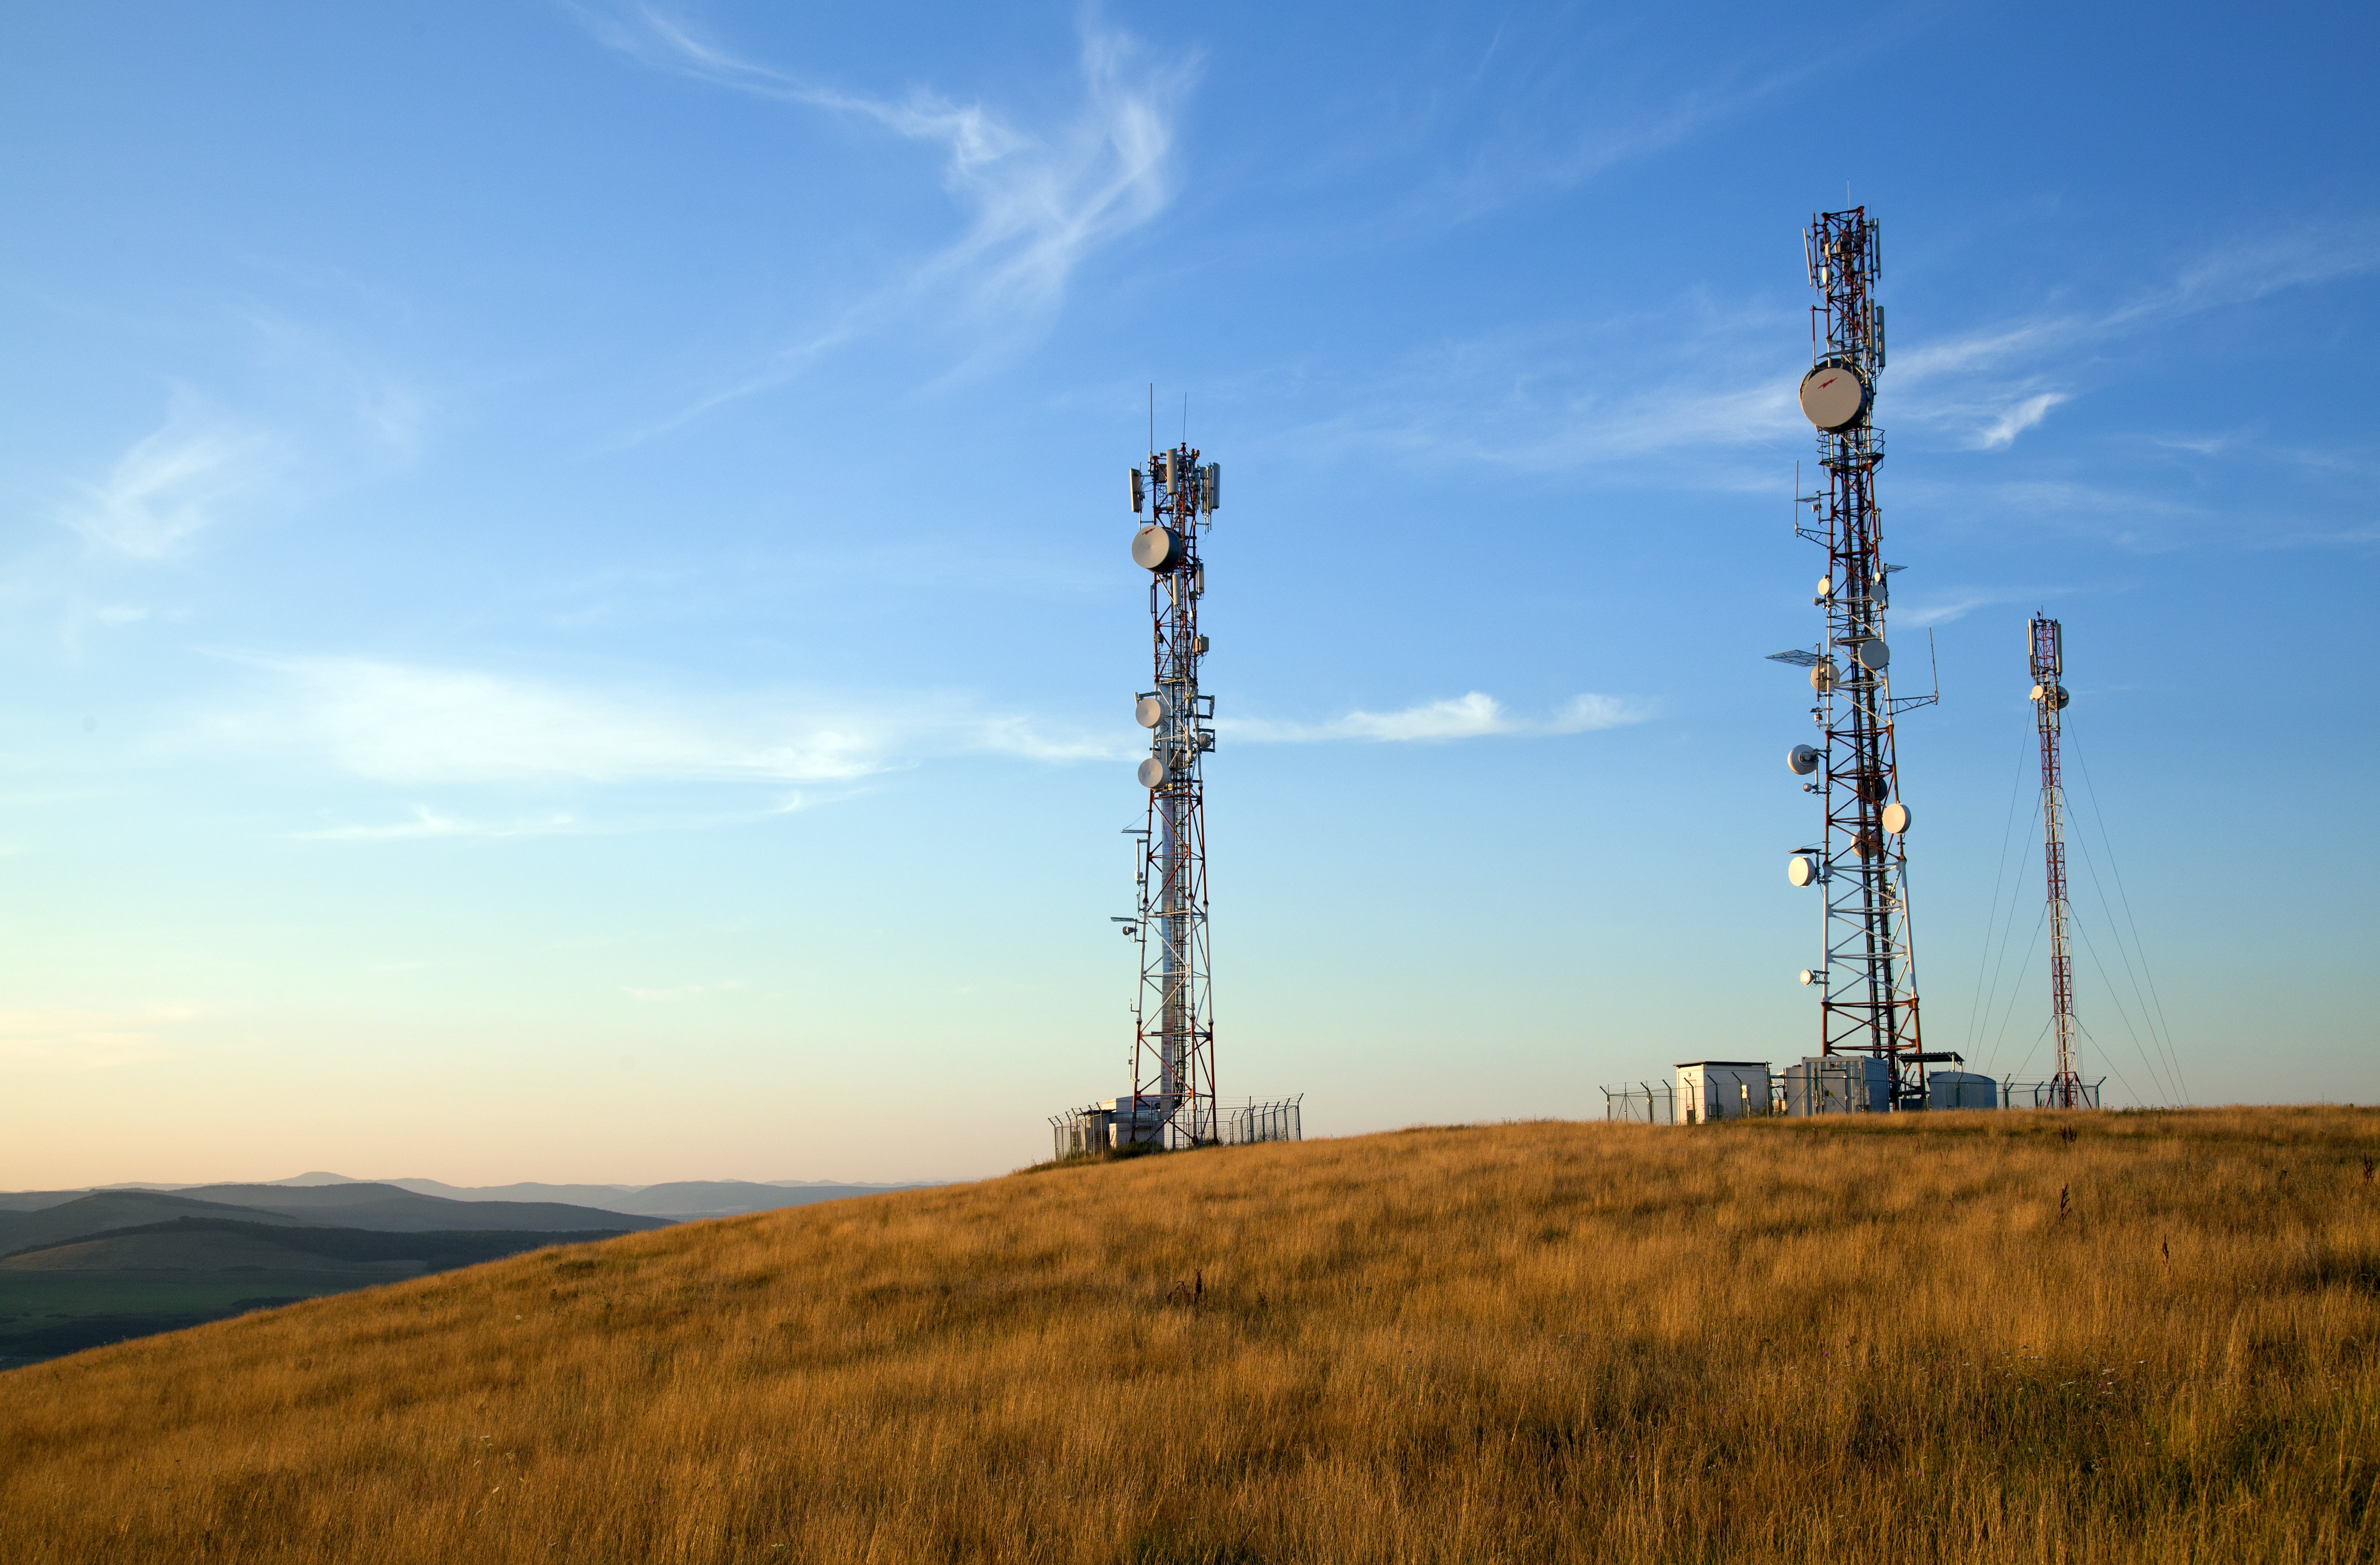
                        <img src="https://www.claritech.io/media/posts/45/cell-site.jpg" alt="" />
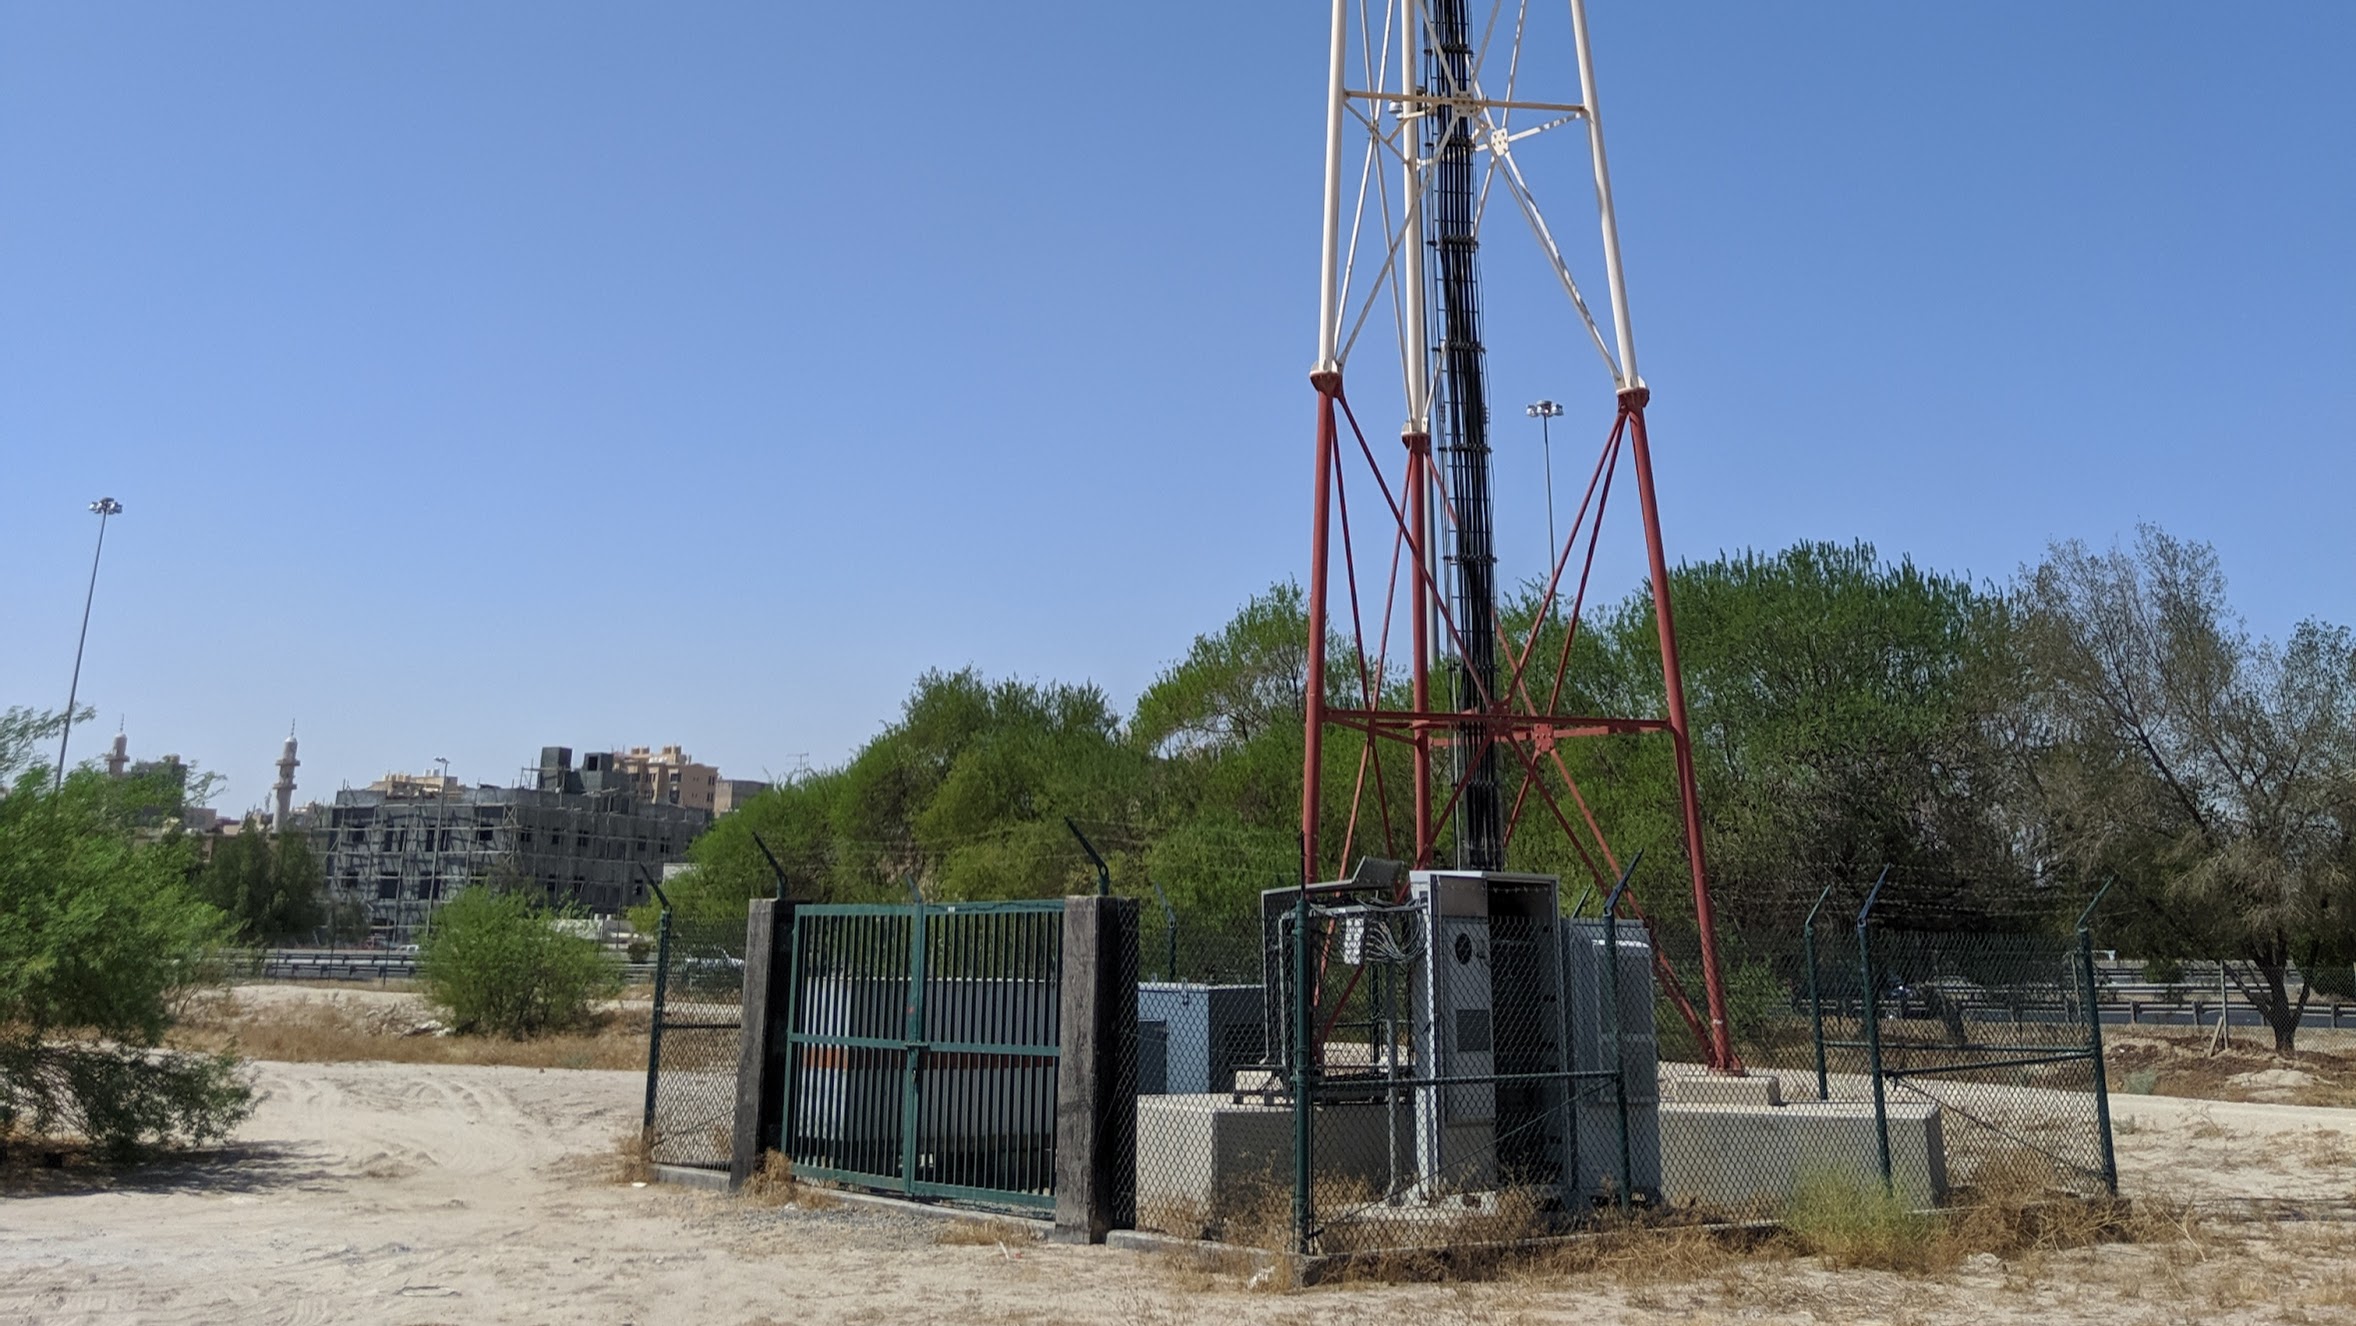
                    By Jon Baars · June 2026 · ClaritechIO An RTU was supposed to solve this. Then an IoT platform. Then new NMS software, a new element management software, a next-generation DCIM, or newer smarter controllers on new site equipment. Each arrived with the same promise:&hellip;
                ]]>
            </summary>
        <content type="html">
            <![CDATA[
                    <p><img src="https://www.claritech.io/media/posts/45/cell-site.jpg" class="type:primaryImage" alt="" /></p>
                <article class="article-wrap"><header class="article-header">
<p class="article-meta">By Jon Baars · June 2026 · ClaritechIO</p>
</header>
<div class="article-body">
<p>An RTU was supposed to solve this. Then an IoT platform. Then new NMS software, a new element management software, a next-generation DCIM, or newer smarter controllers on new site equipment. Each arrived with the same promise: get visibility across the network of power, security, and environmental issues in sites, and give operators a coherent picture of this distributed infrastructure.</p>
<p><strong>None of them solved it</strong> — because every attempted solution was proprietary hardware, proprietary software, or both, and didn't solve a fundamental underlying problem. Proprietary solutions can't be deployed retroactively across 100% of a mixed brownfield network. Each one became another silo. Most networks today are the accumulated result: a mishmash of monitoring approaches.</p>
<p>We know this from the inside. Before ClaritechIO, we spent years trying to get operators to standardize on RTU equipment. We believed in what we were selling and we succeeded where our equipment was built in to 100% of the network from the start, but you can't make a heterogeneous brownfield network homogeneous by adding more hardware to it, and new proprietary software is itself just a new data silo.</p>
<p><strong>The answer isn't hardware or software — a fundamental first issue that must be addressed is standardized data as an architectural layer that lives between the two.</strong> Standardized data is possible from whatever hardware you already have and is compatible in addition to, or as a feed into whatever software you already use.</p>
<p>Here is what changes when you fix the foundation.</p>
<hr>
<h2>1. Reliability Improves Immediately</h2>
<p>Most operators are still working from small bits of passive infrastructure data from their sites. Basically contact alarms or other equivalent SNMP alarms. A tool that allows better visibility, like better dashboarding, ISN'T what actually gets to the fundamental problem. <strong>What you see in any interface is a function of what data exists upstream of it</strong>. A better dashboard just shows you the same sparse data picture more attractively.  We often include dashboards, but what we are doing <strong>isn't just dashboards on data you already have</strong>.</p>
<p>What improves reliability comes BEFORE the software visibility layer: standardized telemetry from every piece of equipment, regardless of vendor. <strong>The largest reliability gains come from switching from the occasional alarming of your existing alarm scheme, to continual standardized telemetry data on TOP of your existing alarm scheme.</strong> You can view this new additional data in Grafana, push it through an AI pipeline, normalize output to include this data within your existing NMS, or use it to create new data and metrics. Without standardized data, no software choice fundamentally improves this situation.</p>
<p>During a natural disaster, an operator needs a triage picture across every affected site — which are on generator, what fuel levels, battery states, grid power, and runtimes are, which sites are trending toward failure. That requires <strong>50–100 variables per cell site per minute, as well as possibly creating new data and metrics, not the threshold alarms you currently have.</strong></p>
<hr>
<h2>2. You Can See Your Entire Network at Once</h2>
<p><strong>A single coherent view of distributed energy, cooling, and security infrastructure doesn't exist for most operators — not because site equipment doesn't produce the needed data, but because this data is inconsistent between vendors.</strong></p>
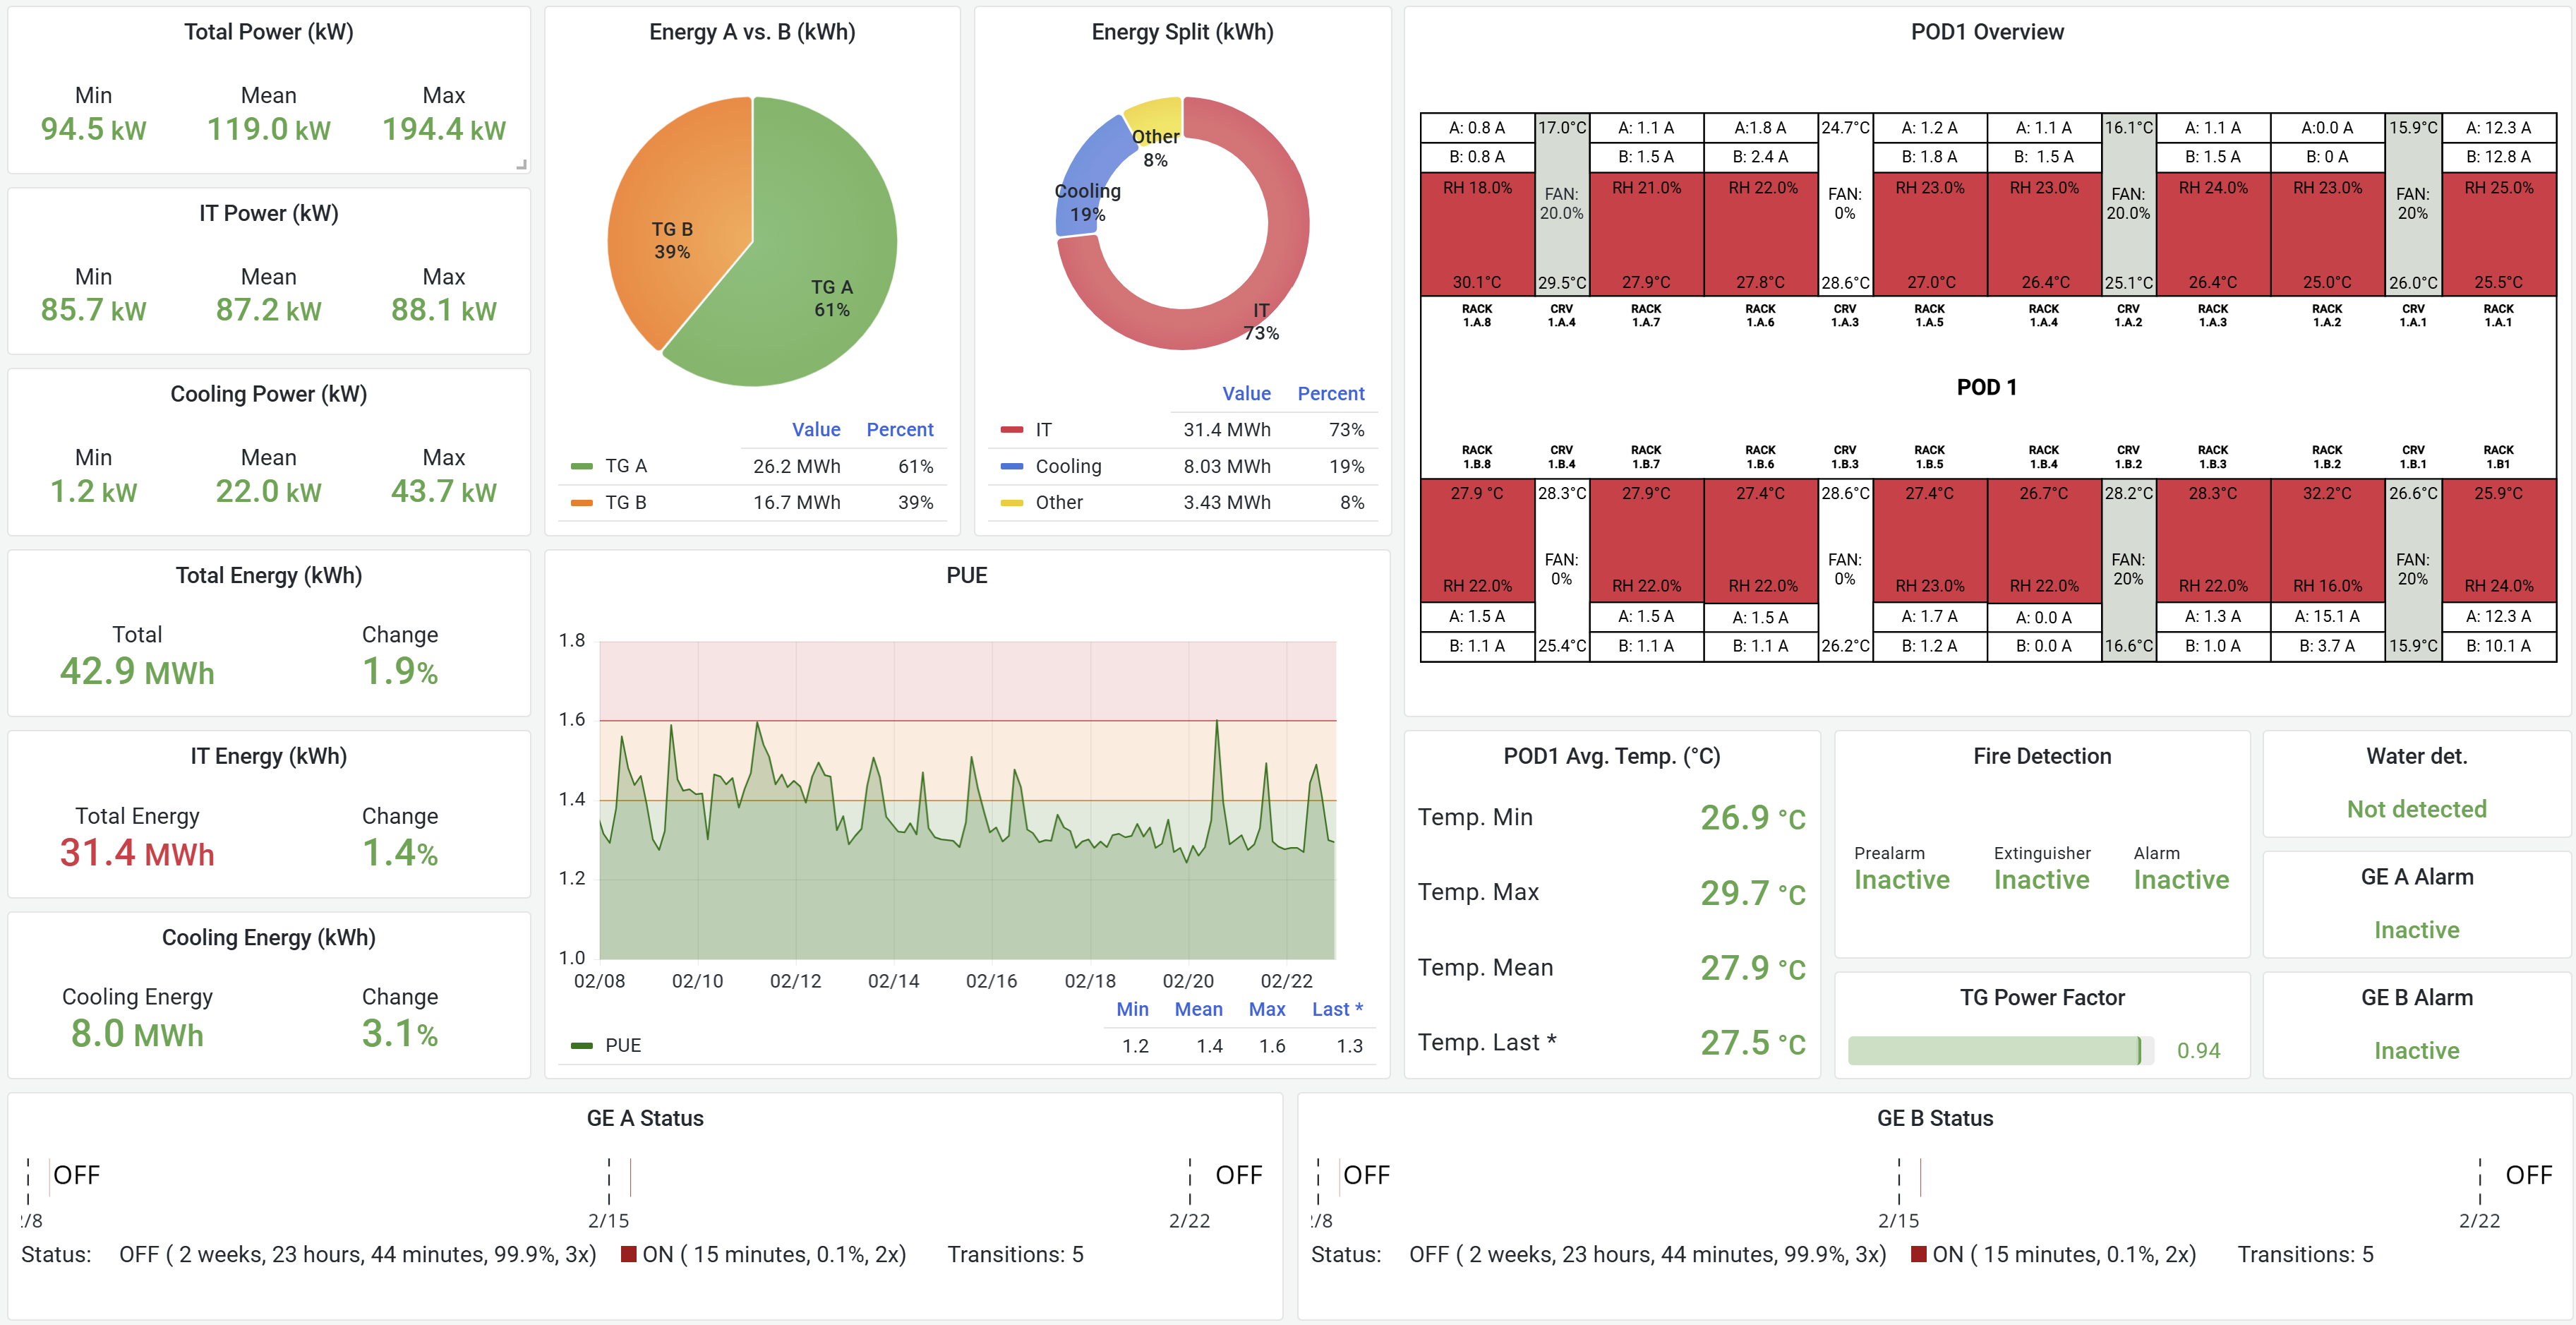
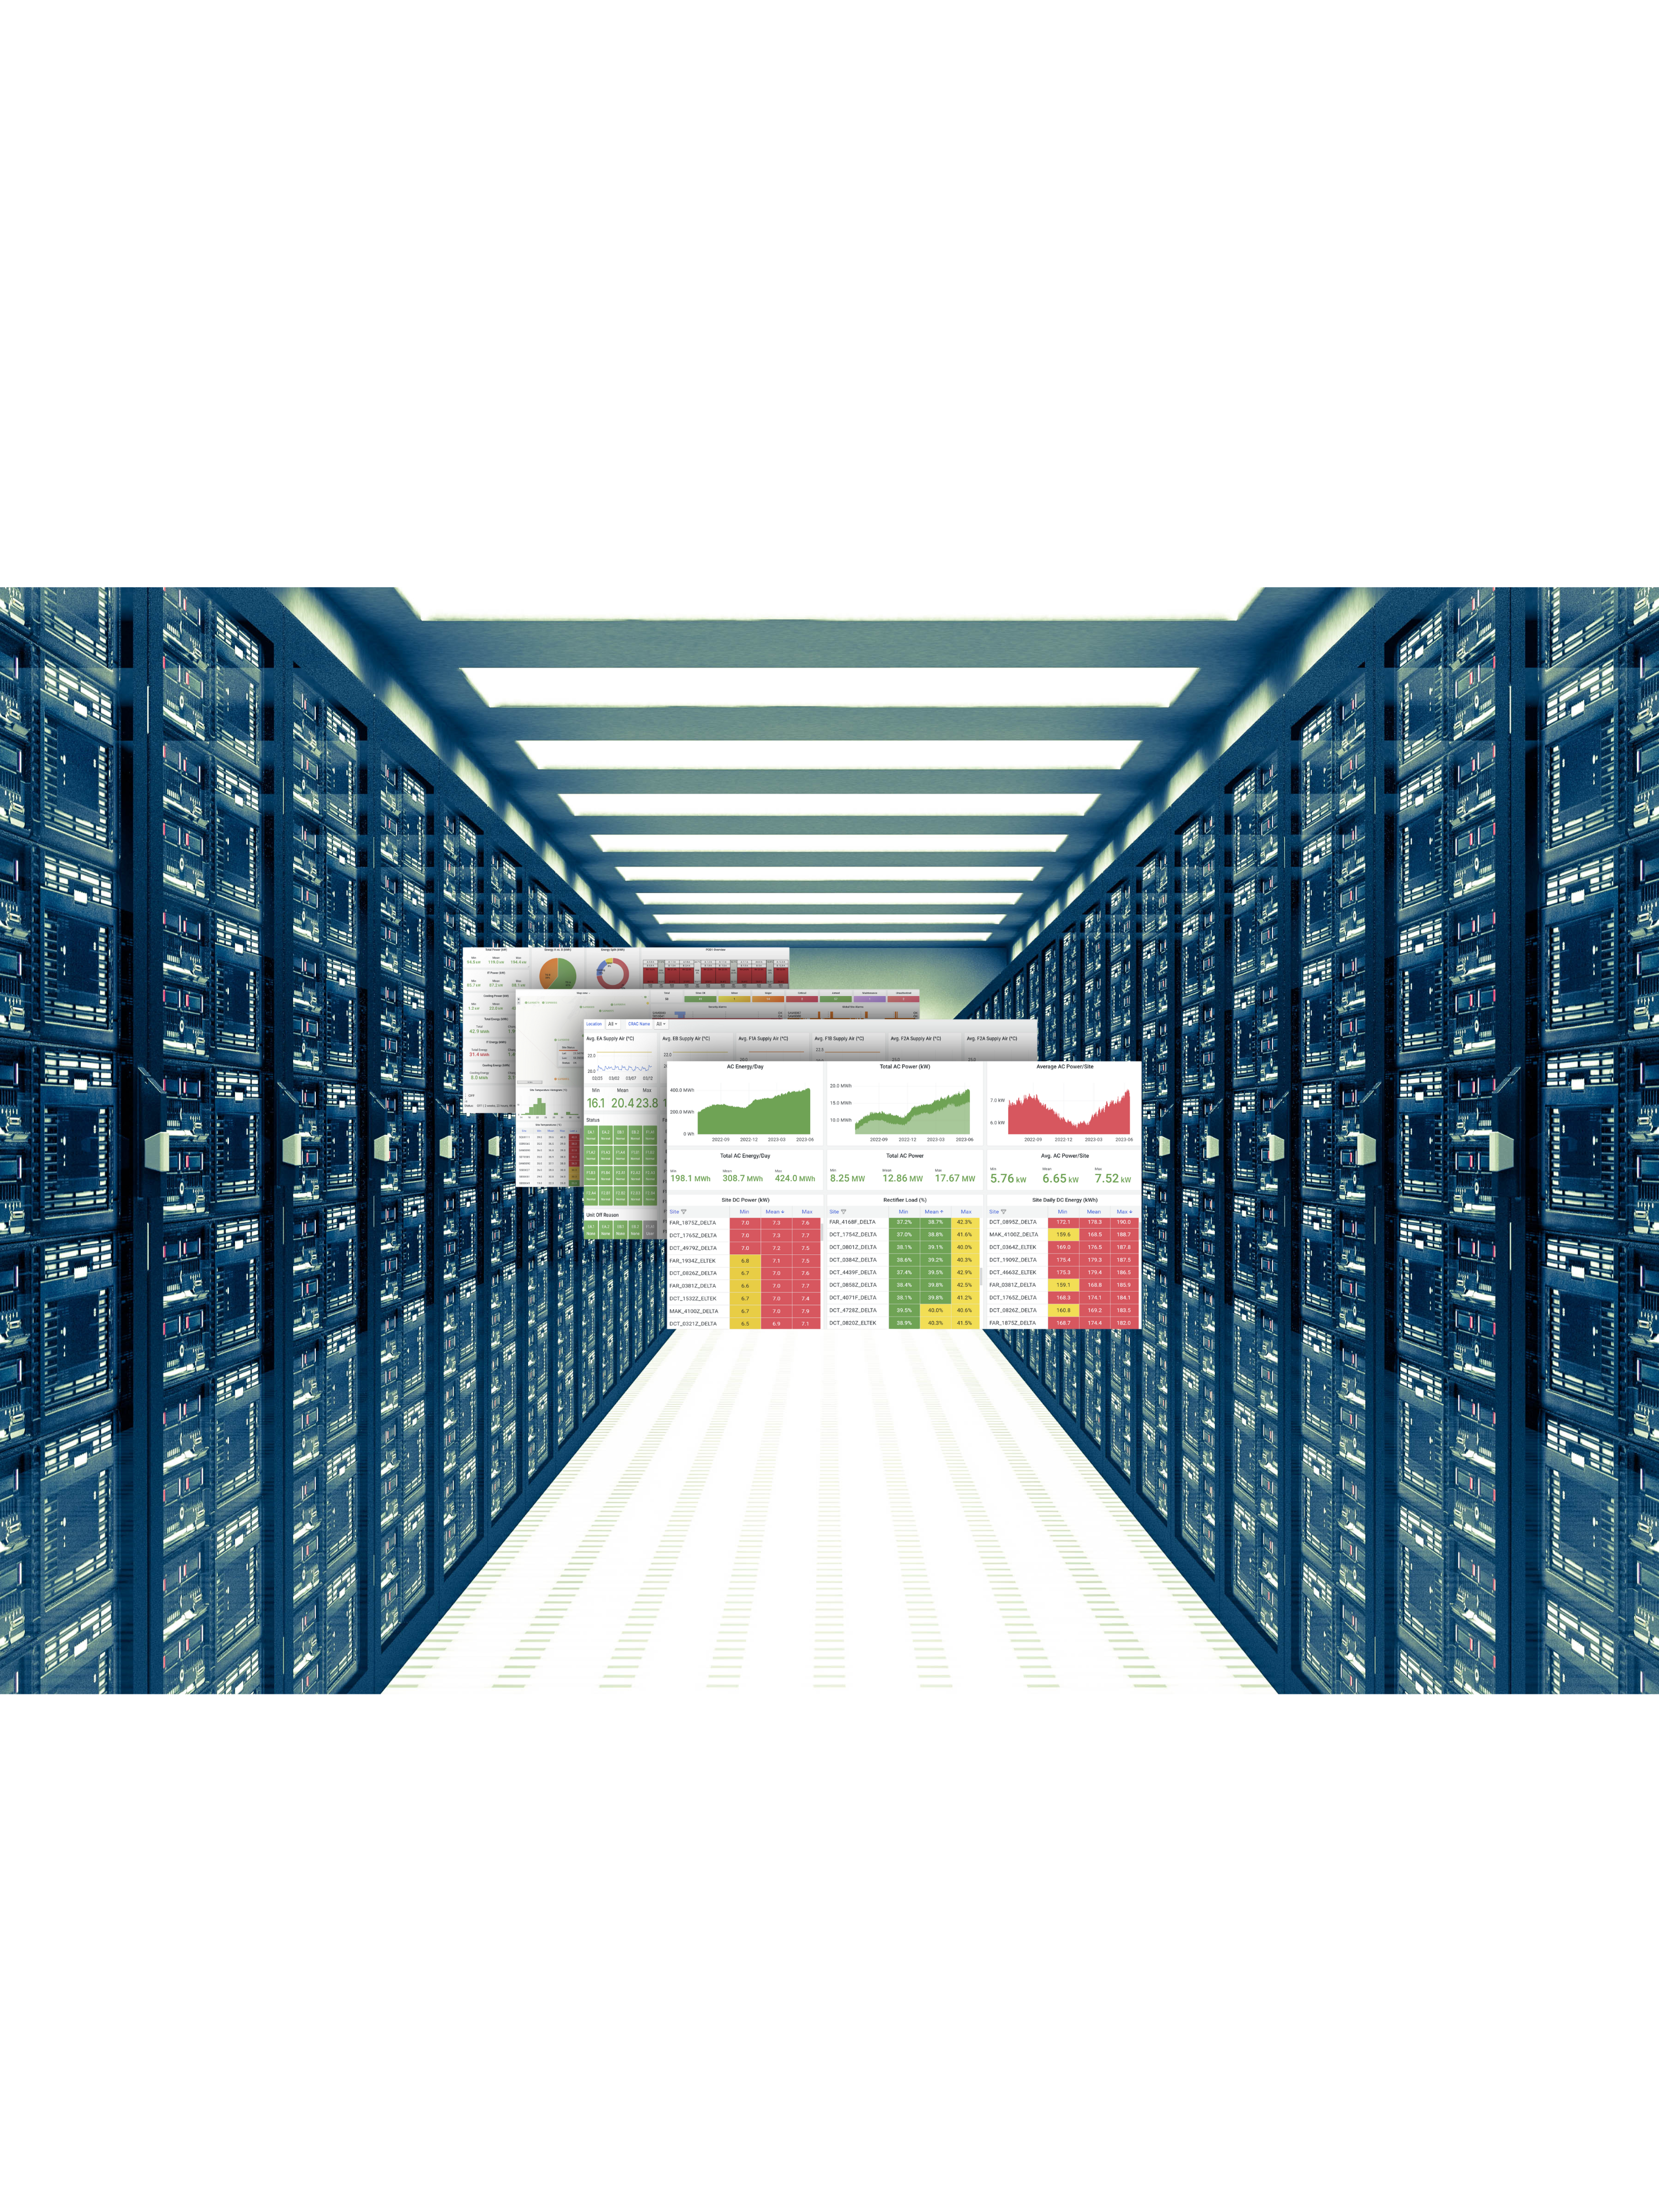
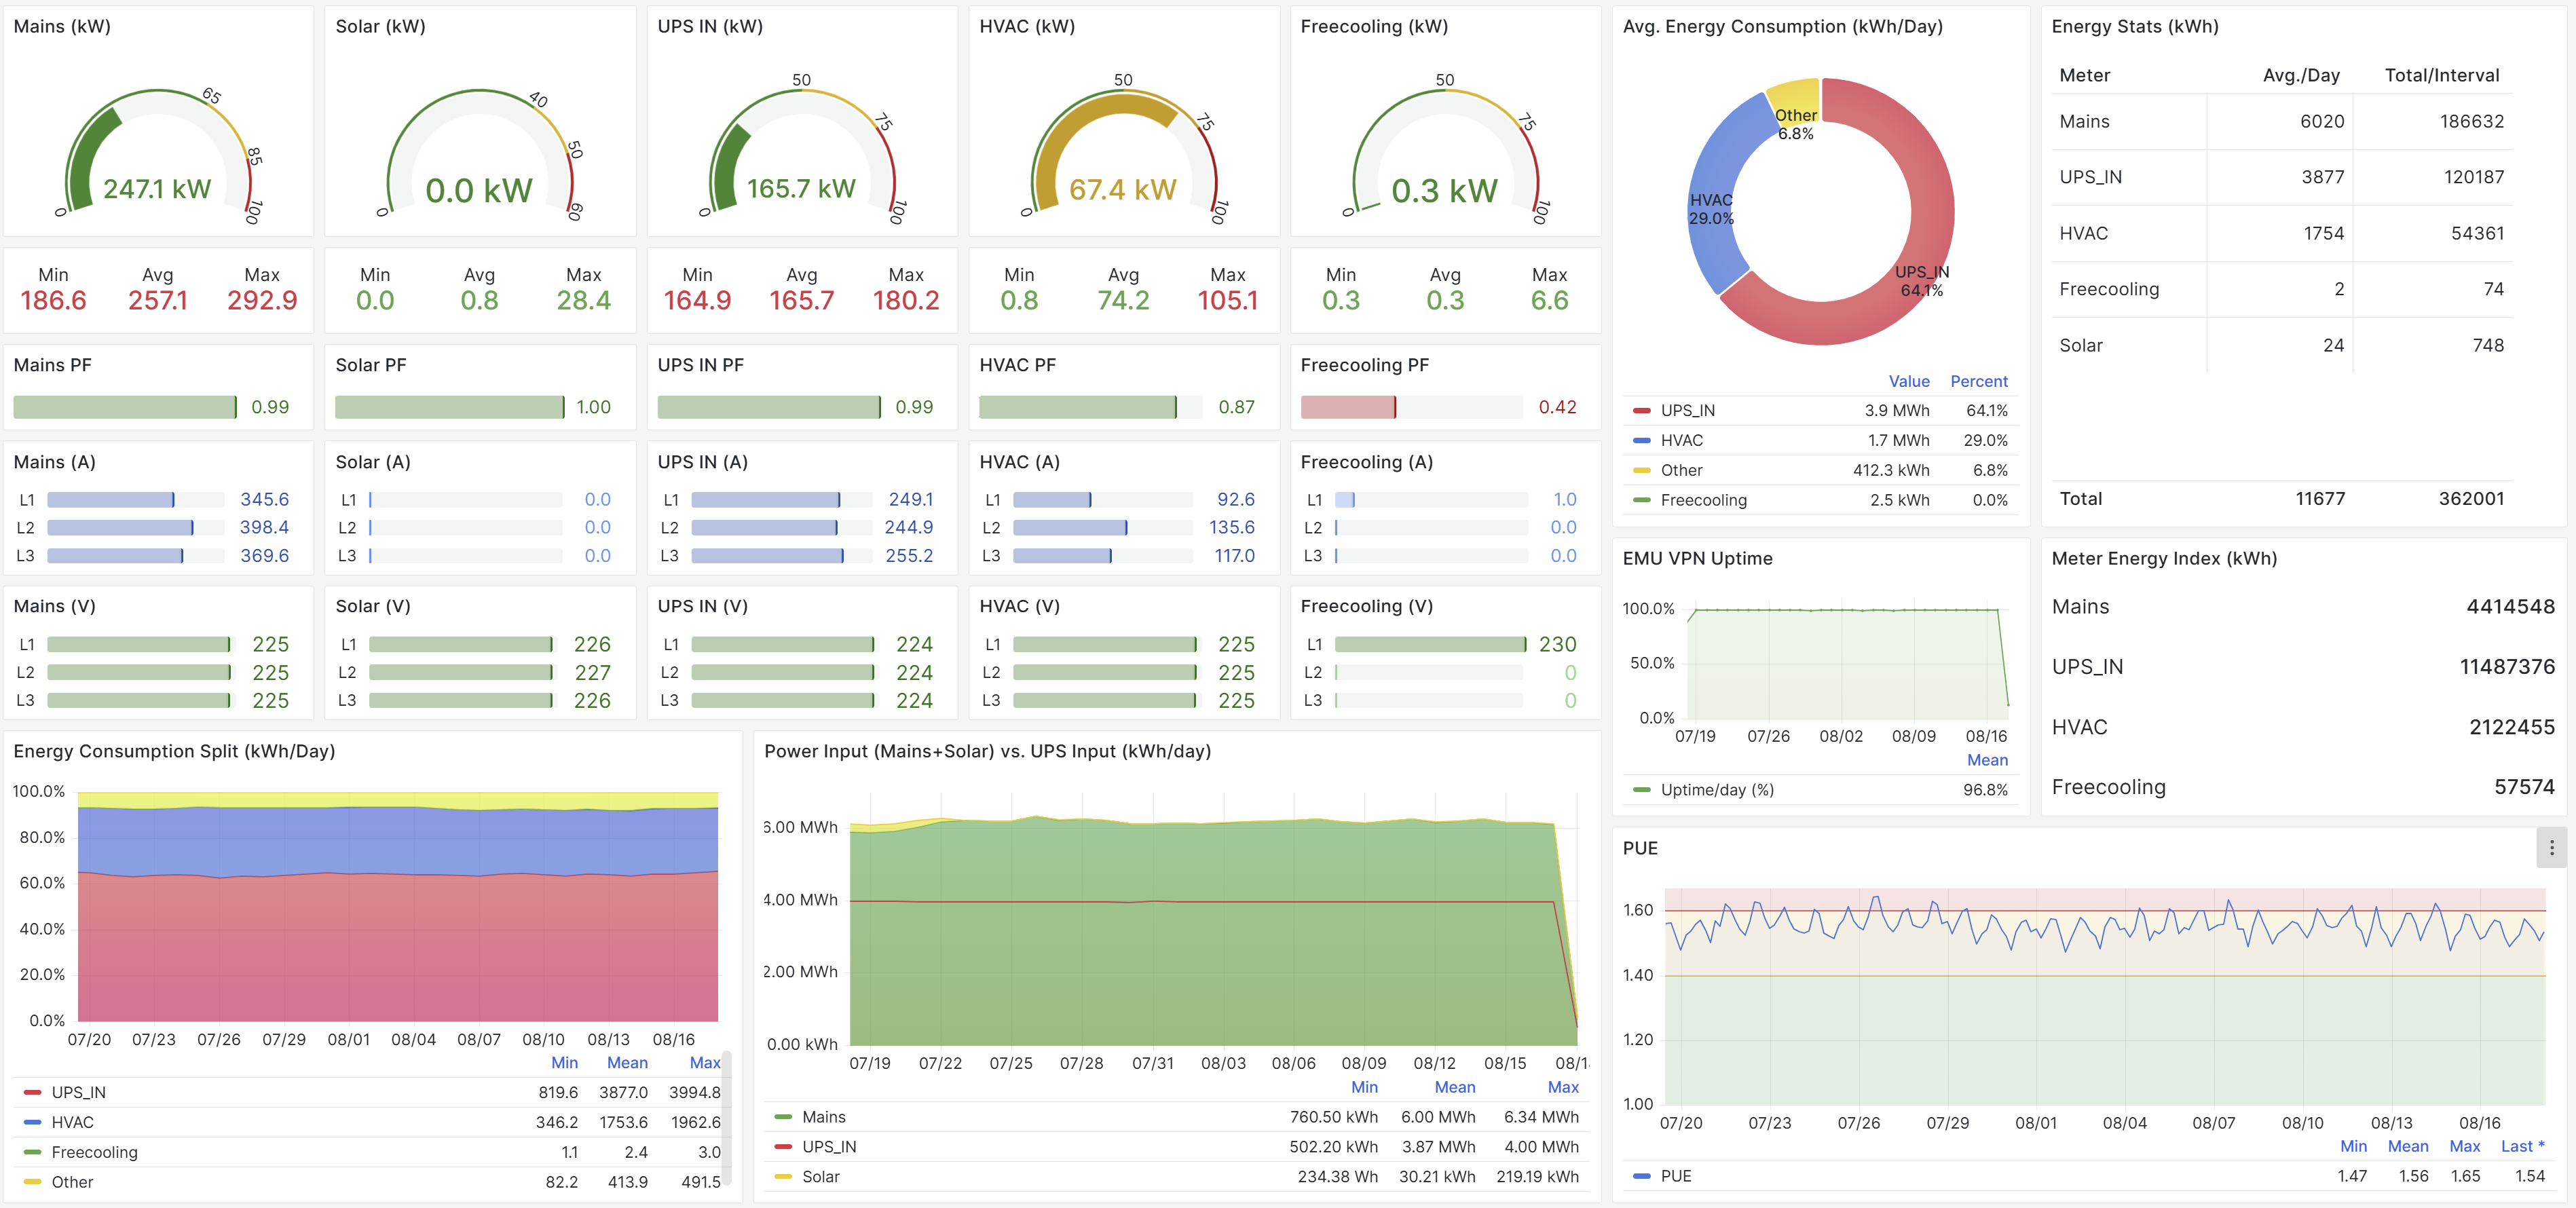
<p>A data layer that normalizes energy, cooling, and security telemetry across every equipment type and vendor produces a single comparable dataset for the first time.  <strong>25,000+ data points per minute from a data center, 50–100 standardized variables per cell site</strong> — across thousands of sites, easily visible in open-source dashboarding tools like Grafana, and creating massive growing data sets for future AI use.</p>
<p>This same data method applies to every site in your network, no matter its size. It can be applied across all your sites, no matter what type of network you are operating.</p>
<hr>
<h2>3. The Economics Are Better from Day One</h2>
<p><strong>By stopping the cycle of proprietary hardware and software initiatives, most operators will find more than enough budget to fund a data strategy network-wide — and likely spend LESS overall than they're spending now.</strong></p>
<p>Legacy RTU monitoring initiatives costs $500–$1,500 in hardware, $500–$1,000 to install, plus annual software licensing and support — over $2,500 per site before even beginning to address the data these devices produce. There are similar costs to vendor element management software with hardware lock-in, IoT solutions, etc.</p>
<p>A managed data layer costs approximately $250 per cell site to implement, depending on how much data is available — integration, standardization, pipeline, and dashboarding included. Data center efforts are priced differently, but still more favorably than chasing retroactive hardware standardization or migrating to new DCIM software. <strong>Your existing equipment is the data source, and in a brownfield network there is no choice but to work with what you have.</strong> Your existing equipment starts delivering what it was always theoretically capable of.</p>
<hr>
<h2>4. Vendor Lock-In Breaks in Both Directions</h2>
<p><strong>There's an organizational benefit here too.</strong> Purchasing wants to put forward a basic spec that any vendor can meet for equipment like cabinets, RTUs, rectifiers, batteries, cooling, and back-up power and let them compete on quality, service, and price. That's the correct instinct. Operations agrees — but is faced with vendor lock-in to try and minimize the number of management interfaces it has to work with. A device that meets every technical spec but uses different management naming conventions creates a new data silo that Operations then has to manage to get even today's minimal visibility into the network.</p>
<p>The result is predictable: either Operations lobbies to buy incumbent vendors again despite better or cheaper alternatives, or Purchasing goes with the more competitive equipment and hands Operations another seemingly unsolvable integration problem.</p>
<p><strong>A data strategy resolves both sides of this.</strong> When standardized telemetry exists independent of any vendor's management layer, Purchasing's hardware decisions can be made purely on merit — quality, price, performance. If something better comes along, you move to it. The best equipment is usually the one that is best at performing its role (cooling, rectification, etc.), outside of what its management interface is.  Operations utilizes the data layer to integrate the new equipment to standards.  The data layer solves both the problems of the inconsistent existing brownfield networks, as well as the going forward purchasing decisions.</p>
<p>We apply this logic when recommending various equipment to add functionality to the network as well: cameras, AC meters, PDUs, modems, RTUs and switches. Just choose the best available hardware from a price vs. performance basis, because the data layer removes the vendor dependency that made those decisions complicated.</p>
<hr>
<h2>5. You Own the Data</h2>
<p><strong>Proprietary monitoring tools give you access to what the vendor built, on the vendor's terms.</strong> When a better analytical capability emerges, or when AI systems need access to that data, you're stuck.   </p>
<p>A data layer built on open standards is different. That dataset feeds Grafana, Snowflake, an AI model, a billing system, existing NMS/DCIM, or new AIops tools. No permission required. In our opinion, what is coming next is inevitable, and owning your own data free and clear is going to be fundamentally important.  Unlike adding new hardware or software, <strong>data never becomes obsolete. </strong></p>
<hr>
<h2>6. Energy Efficiency Becomes Measurable</h2>
<p><strong>Networks are not operating efficiently right now and operators don't know it, because the data to see it doesn't exist.</strong> Every network we've worked on using these methods initially show <strong>large numbers of sites operating significantly outside normal parameters.</strong></p>
<p>Simply comparing site energy usage using data visualization tools points out significant problems immediately. Human directed correction of issues made obvious in an open-source tool like Grafana can save 1–2% of total energy spend. This isn't some advanced AI method, this is simply viewing sites that are far out of range on power consumption, cooling ranges, and other variables.</p>
<hr>
<h2>7. AI Readiness Starts Now — We're Already There</h2>
<p><span style="color: #02192b;">We started almost 10 years ago augmenting more traditional hardware monitoring tools</span> with open-source data streaming tools — Kafka, InfluxDB, Kubernetes, Grafana and others — tools that are now standard in every industry. These tools solve so many problems related to network-wide visibility, security, scaling. We keep finding benefits from using them. One large benefit to adopting such widely used tools, is that it has led us directly to AI use cases.</p>
<p>We have <strong>production</strong> AI deployments running today on telecom data center cooling infrastructure — Google TimesFM 2.5 models with 14 months of backtested energy telemetry (currently), 50+ walk-forward simulations, with projected HVAC savings of up to 21,693 kWh per year.</p>
<p><strong>The opportunities in data center management are substantial</strong>: cooling optimization, load prediction, predictive maintenance, and capacity planning.</p>
<p><strong>The opportunities in cell networks are also substantial</strong>: RRU power-saving features, HVAC optimization, battery cycling, diesel scheduling.</p>
<p>All require the same data foundation. Energy efficiency and AI operations capability have nearly identical prerequisites.</p>
<p>The worry about taking the wrong fork in the road on AI strategy is legitimate. This data foundation is the correct fork. Every AI application in infrastructure operations builds on top of it — and nothing useful can be built without it.</p>
<hr>
<h2>8. Deployment Is Fast and Non-Disruptive</h2>
<p><strong>FOCUS runs as a network overlay — it doesn't replace the NMS or displace the DCIM.</strong> Existing alarm schemes stay intact. Nobody retrains. Hundreds of sites in weeks, not years, without site-by-site hardware deployment.  It isn't a choice to move away from what you are doing now, it is added to it.</p>
<hr>
<h2>9. New Business Models Become Possible</h2>
<p><strong>Standardized telemetry unlocks capabilities — and partnering opportunities — that don't exist before the foundation is in place.</strong> For towercos and data center operators, energy billing becomes a direct revenue application: accurate, automated, audit-ready. ESG reporting, GSMA benchmarking, ISO 50001, and carbon accounting all run on the same continuous data that feeds operations.</p>
<p>The data also becomes combinable. Vendor partners, application developers, and AI platforms can layer capabilities onto a standardized stream without custom integration at every site.  This data can be paired with AIOps initiatives, RRU PSF efforts, combined with billing or weather data.</p>
<hr>
<h2>Why We Built This</h2>
<p>We started ClaritechIO because we believe this architectural shift is inevitable. Open-source data tools are mature, already far better than existing solutions, and constantly improving. AI is going to require this standardized infrastructure data. The economics of proprietary hardware and software keep getting harder to justify. Operators who move now spend less, fix the reliability problem, and arrive at AI readiness ahead of everyone who waited, AND the solutions that can be created quickly and generate immediate reliability and efficiency returns.   <strong>It doesn't just fit certain networks, it fits every network.</strong></p>
<p>A 5 site trial is the technical foundation for a 5000 site or 50000 site network. The data starts being useful immediately.</p>
<div class="cta-section">
<p>If this describes the problem you're working through, a trial is the fastest way to answer the question. <strong><a href="mailto:sales@claritech.io">sales@claritech.io</a></strong></p>
</div>
</div>
<footer class="article-footer">
<p>ClaritechIO builds FOCUS, a managed energy data layer for telecom networks, data centers, tower companies, and mobile network operators.</p>
</footer></article>
            ]]>
        </content>
    </entry>
    <entry>
        <title>Two Sides of Data Standardization in Telecom Networks</title>
        <author>
            <name>Jon Baars</name>
        </author>
        <link href="https://www.claritech.io/nms-dcim-alarm-data-integration/"/>
        <id>https://www.claritech.io/nms-dcim-alarm-data-integration/</id>
        <media:content url="https://www.claritech.io/media/posts/44/AZ2r0dSSvb9h7lB3pH3C6g-AZ2r0dSSqozXFBsJvr_G1A.jpg" medium="image" />
            <category term="All Articles"/>

        <updated>2026-06-16T10:03:30-07:00</updated>
            <summary type="html">
                <![CDATA[
                        <img src="https://www.claritech.io/media/posts/44/AZ2r0dSSvb9h7lB3pH3C6g-AZ2r0dSSqozXFBsJvr_G1A.jpg" alt="" />
                    ClaritechIO · June 2026 Every major natural disaster causes problems for telecom networks. The people who have managed networks through those events know the quality of passive infrastructure — generators, DC plant, HVAC, batteries — is critical. What is less understood is the accompanying data&hellip;
                ]]>
            </summary>
        <content type="html">
            <![CDATA[
                    <p><img src="https://www.claritech.io/media/posts/44/AZ2r0dSSvb9h7lB3pH3C6g-AZ2r0dSSqozXFBsJvr_G1A.jpg" class="type:primaryImage" alt="" /></p>
                <div class="article-wrap"><header class="article-header">ClaritechIO  ·  June 2026</header>
<div class="article-body">
<p>Every major natural disaster causes problems for telecom networks. The people who have managed networks through those events know the quality of passive infrastructure — generators, DC plant, HVAC, batteries — is critical.  <strong>What is less understood is the accompanying data problem associated with this passive infrastructure.</strong></p>
<p>During any natural disaster, what an operator actually needs to see looks something like this: which sites are on generator right now, what are actual fuel levels and estimated runtime at each one, which sites have already failed and why, whether cooling is holding at sites still running, battery state of charge at sites where generator hasn't yet kicked in, and which sites are trending toward failure in the next few hours versus which ones are stable. That's a triage and prioritization picture across potentially thousands of sites in real time, during the event itself.</p>
<p>What most operators have had access to, historically, is much closer to a low-fuel alarm. A single contact closure. Not a dataset.</p>
<p>One response to that gap has been to spend heavily on RTU infrastructure. The intent was sound. The result was limited. What an RTU delivered, even at significant cost per site, was still fundamentally alarm-level visibility. An as needed SNMP get of a single OID representing fuel level. A contact closure that triggered when a threshold was crossed. Not actual fuel quantities across the network. Not system-generated metrics that are truly useful like network-wide estimated run times.</p>
<div> </div>
<div class="callout">The equipment was capable of reporting detailed telemetry for decades. The problem was that nothing could collect it all, standardize it, and deliver it in a usable form across a mixed-vendor, multi-site network. The tooling to do that reliably didn't exist yet. So the expectation of solving it faded over time.</div>
<p>Data streaming changed that. Not as a vendor category someone invented to sell — as a set of open tools that matured to the point where the problem is truly addressable. What is now possible is 50 to 100 standardized variables per site per minute. Power draw, fuel level, battery state, HVAC status, access events, life safety alerts — continuously, across the entire network, from whatever equipment is already deployed. That is a categorically different class of information than an SNMP alarm. </p>
<p>We found this through years of working the problem directly, across telecom networks and data centers. It did not begin as a planned strategy. It was where years of work finally led us.</p>
<hr>
<h2>The Input Side: Why Normalization Across Equipment Is the Foundation</h2>
<p>The first half of the data standardization problem is the one that occasionally gets discussed. A brownfield telecom network or data center built over decades does not have uniform equipment. It has generators from one vendor, DC plant or PDUs from another, HVAC and cooling from several more, RTUs from whoever was preferred at the time of each deployment, smart meters added later, legacy equipment with no remote interface at all. Each of these has a different management interface, using different protocols, naming conventions, scales, and units.</p>
<p><strong>Unless something normalizes all of that into a coherent dataset, you do not have network-level visibility. </strong>You have islands. An energy manager can see one vendor's equipment in one platform, another vendor's in a separate system, and a significant portion of the network can't be seen at all. Cross-site comparison is impossible. Trending is impossible. The kind of operational picture described above — fuel levels, generator status, and site life estimates across your entire network simultaneously — is impossible.</p>
<p>Input standardization is the prerequisite for everything else. The equipment has been capable of producing this data all along. What was missing was the layer that asked for it consistently, normalized it across every equipment type, and delivered it in a single coherent format.</p>
<p>This is not a general data engineering problem. The telecom power and data center environment is deeply specialized — protocols, equipment classes, edge cases, and failure modes accumulated across decades of heterogeneous deployments. Building and maintaining that normalization layer correctly is the work. The open-source tools that make it possible — Kafka, InfluxDB, MQTT, Grafana — are the infrastructure that carries it, but they are not the expertise.</p>
<hr>
<h2>The Output Side: The Half Nobody Talks About</h2>
<p>Input standardization is becoming understood, at least in principle, as a problem worth solving, but the output side is just as important.</p>
<p>Consider what exists in a mature telecom network or data center before a new data layer arrives. A Network Management System (NMS) with an alarm scheme the NOC has worked from for years. 24, 32, or 64 contact closures feeding into that NMS, mapped to specific alarm categories, tied to trouble ticketing systems, driving workflows that have been established and refined over time. In a data center, a Data Center Infrastructure Management (DCIM) system with naming conventions and alarm hierarchies the operations team knows cold, as well as requirements for meeting certain regulatory standards.</p>
<p><strong>These legacy systems are non-negotiable.</strong> The alarm output to the NMS is not a preference — it is the operational spine of how the network is managed. Thousands of sites, associated ticketing, established escalation paths. Nobody is going to adopt something that puts any of that at risk. Nor should they.</p>
<p>The output standardization problem is this: a new data layer that speaks a different language — even a better one — creates friction that stalls adoption. If the alarms, events, and telemetry produced by the new system don't map to what the NOC already knows, someone has to reconcile the two. That reconciliation is a financial cost, an operational risk, and a change management problem. It is exactly the kind of friction that causes good technology to sit unused.</p>
<p><strong>The answer is to standardize the output too. Deliver alarms, telemetry, and events in the format, naming conventions, and hierarchy the operator's existing systems already use.</strong> Don't alter the existing systems already in use at all. Just provide new, additional data in a form that matches the existing data. The NOC sees what it has always seen. Trouble ticketing works the way it always has. Nobody retrains. Nothing breaks.</p>
<div class="callout">Standardization has to happen at both ends. What comes in needs to be normalized across every equipment type and vendor. What goes out needs to speak the language of wherever it's going — whether that's an NMS, a DCIM, or a downstream analytics platform.</div>
<p>It is the same normalization discipline applied in both directions. The capability to do the output side was always present in the work we were doing on the input side. A customer surfaced the use case and we recognized it as the obvious extension of a principle we were already applying.</p>
<hr>
<h2>What This Looks Like in Practice</h2>
<p>In a data center environment, this means FOCUS alarm output can match the naming conventions and hierarchy used in an existing DCIM. A data center might have four standard categories — Power &amp; Energy, Cooling, Life Safety, Security — mapped to whatever scheme is already in use. The escalation structure — equipment level, subsystem level, category level, facility headline — mirrors what the operations team already works from. An alarm visible in Grafana is consistent with what the team sees in their existing DCIM.</p>
<p>In a cell network, the same principle applies to the NMS. An operator with an established alarm taxonomy — however that system categorizes power, security, and environmental issues — receives standardized FOCUS output in that format. The NOC works the way it always has, but the dataset available underneath that workflow is now 50 to 100 variables per site per minute instead of a handful of threshold alarms.</p>
<p><strong>In both cases, FOCUS runs alongside the existing system. It does not replace the NMS. It does not displace the DCIM.</strong> Over time, as the granular dataset grows and the coverage extends to equipment and sites that were previously dark, it becomes the more trusted source of operational truth. What operators choose to do with their legacy systems at renewal time is their decision to make. The data layer makes itself indispensable first.</p>
<hr>
<h2>Why This Matters Now</h2>
<p>The arrival of data streaming tools has unlocked something that was technically impossible to do at reasonable cost even a few years ago. <strong>The ability to collect 50 to 100 variables per cell site per minute, or thousands per minute in a data center, standardize them across every equipment vendor in a heterogeneous network, and deliver them in a format that feeds or works alongside existing operational workflows — that capability is new.</strong> The layer that could collect, normalize, and deliver this data at scale simply did not exist.</p>
<p>Traditional hardware vendors cannot lead this transition. Their business models depend on proprietary hardware at each site. <strong>Standardized data streaming makes hardware interchangeable</strong> — which works directly against how those businesses make money. Traditional software vendors get closer, but even the best of them solve only the input side, creating proprietary output formats that produce a new version of the same lock-in problem.</p>
<p>The operators who recognize this earliest are building a data asset that compounds in value. Every month of continuous, granular, normalized energy telemetry is a dataset that improves with age — as AI tooling matures, as benchmarking across larger site populations becomes possible, as cross-site pattern recognition surfaces things that single-site analysis never could. The <strong>operators who keep solving this with monitoring hardware additions and software licenses are paying more, accumulating less, and narrowing their options for what comes next.</strong></p>
<p>The two sides of standardization are not separate problems. They are two requirements of the same solution. Getting the input right without getting the output right produces a dataset that never reaches its potential — blocked by the operational friction of a system that doesn't speak the language of the people who would use it. Getting the output right without getting the input right produces a well-formatted stream of incomplete information.</p>
<p>Both sides have to work. Let us know if you'd like to know more. We believe this approach, <strong>which is significantly better AND less expensive</strong>, will be in use in every network in the near future.</p>
<div class="cta-section">
<p><a href="mailto:sales@claritech.io">sales@claritech.io</a></p>
</div>
</div>
<footer class="article-footer">ClaritechIO builds FOCUS — a managed data layer for telecom networks, towercos, and data centers. claritech.io</footer></div>
            ]]>
        </content>
    </entry>
    <entry>
        <title>The RTU Bill Comes Due: Why the Economics of Telecom Site Monitoring No Longer Add Up</title>
        <author>
            <name>Jon Baars</name>
        </author>
        <link href="https://www.claritech.io/the-rtu-bill-comes-due-why-the-economics-of-telecom-site-monitoring-no-longer-add-up/"/>
        <id>https://www.claritech.io/the-rtu-bill-comes-due-why-the-economics-of-telecom-site-monitoring-no-longer-add-up/</id>
        <media:content url="https://www.claritech.io/media/posts/43/IMG_1802-Copy.JPG" medium="image" />
            <category term="All Articles"/>

        <updated>2026-05-12T10:10:51-07:00</updated>
            <summary type="html">
                <![CDATA[
                        <img src="https://www.claritech.io/media/posts/43/IMG_1802-Copy.JPG" alt="" />
                    At some point in the lifecycle of an operator network, someone puts the per-site telecom site monitoring math on paper. They add up the hardware cost, installation, annual software licensing, and internal management time — and ask a direct question: what did we actually get&hellip;
                ]]>
            </summary>
        <content type="html">
            <![CDATA[
                    <p><img src="https://www.claritech.io/media/posts/43/IMG_1802-Copy.JPG" class="type:primaryImage" alt="" /></p>
                <article class="article-wrap"><header class="article-header">
<p class="font-claude-response-body break-words whitespace-normal leading-[1.7]">At some point in the lifecycle of an operator network, someone puts the per-site telecom site monitoring math on paper. They add up the hardware cost, installation, annual software licensing, and internal management time — and ask a direct question: what did we actually get for this?</p>
<p class="font-claude-response-body break-words whitespace-normal leading-[1.7]">The numbers that come back are not comfortable. And the industry's equipment vendor's proposed response — a new generation of the same approach — is not going to make them more comfortable.</p>
<p class="font-claude-response-body break-words whitespace-normal leading-[1.7]">This is worth working through carefully, because the stakes are high and the answer is not obvious.</p>
</header>
<div class="article-body"><hr>
<h2>The Math Nobody Wants to Do</h2>
<p>Hardware and installation costs vary significantly across the market.  A basic remote terminal unit (RTU) unit from a vendor who is primarily interested in selling software could be around $500. A more capable RTU from a hardware specialist can run well over $1,000 — plus installation, plus a configuration service just to take the unit from a factory default to something reasonable for a specific site type.  The configuration cost alone is in the range of what a managed data layer costs in its entirety.</p>
<p>Whatever you paid for the unit, that is before you've even started to address the actual problem — standardizing the available data from your sites, delivering it consistently across a heterogeneous network, making it comparable and useful at scale. <strong>That work still has to happen</strong>. Someone still has to figure out how to normalize what the RTU produces alongside everything else in the network, how to deliver and store it, and how to make it comparable and useful across thousands of sites built on equipment from dozens of vendors over several decades.</p>
<p>That problem — the real problem — is where the value of most RTU deployments typically stall. The hardware gets deployed. A simpler alarm scheme gets configured, but the deeper work of turning raw device output into something genuinely valuable never fully materializes.</p>
<div> </div>
<div class="callout"><strong>Dollar one of the data work you have to do after deploying an RTU is also dollar one of deploying FOCUS</strong>. The difference is that FOCUS doesn't begin with the hardware entry fee as it interfaces to the intelligent equipment already in your network, often avoiding the need to deploy any additional hardware, and it solves the data problem the RTU was never going to solve anyway.</div>
<p>Whether hardware costs $500 or $2,000, the scope of the data work that follows is basically the same. <strong>An RTU is just a tool, someone still needs to know how to utilize it.</strong>  Across thousands of sites, that hardware sunk cost is an enormous number. What operators are now asking — with some urgency — is what operational improvement that investment actually delivered.</p>
<hr>
<h2>What Contact Closures Were Actually Solving</h2>
<p class="font-claude-response-body break-words whitespace-normal leading-[1.7]">To understand why this has occured, it helps to understand a bit of history and what contact closures were designed to do. Historically, networks were built across equipment from dozens of vendors over decades, with <strong>no common data standard</strong>. Getting any consistent status picture across a heterogeneous network was nearly impossible.</p>
<p class="font-claude-response-body break-words whitespace-normal leading-[1.7]">Contact closures solved that by reducing everything to the same language: a major power alarm, a minor power alarm, a high temperature alert. Binary signals any piece of equipment could produce and any monitoring system could interpret. The standardization was real and had genuine operational value — something broke, you knew it at every site, regardless of who made the equipment.</p>
<p class="font-claude-response-body break-words whitespace-normal leading-[1.7]">RTUs extended that model and could do more. Many were sophisticated machines capable of reporting far richer data. The problem was that without a real data layer above them, there was nowhere useful for that richer data to go. The telemetry got discarded. What survived upstream was again a set of SNMP traps — a more expensive version of what contact closures had always produced. The industry settled for alarms, because alarms were what the rest of the system could handle.</p>
<p class="font-claude-response-body break-words whitespace-normal leading-[1.7]">The result: most RTU deployments are dealing in alarms, not telemetry. Equipment efficiency, trend analysis, site comparisons, the early signatures of a component approaching failure, many measures it would seem you should be able to get from your network, none of that survived the translation.</p>
<hr>
<h2>New Hardware Doesn't Fix This</h2>
<p class="font-claude-response-body break-words whitespace-normal leading-[1.7]">The natural industry response from equipment vendors is new hardware or hardware features. Smarter controllers from power equipment vendors. Next-generation RTU-like devices with better connectivity and modern interfaces. New software platforms to support specific hardware.</p>
<p class="font-claude-response-body break-words whitespace-normal leading-[1.7]">The structural problem is unchanged. Adding more non-standard devices, no matter how smart or featured they are, alongside the tens of thousands already deployed devices doesn't reduce fragmentation — it adds to it.  Even if the new device is genuinely better, the overwhelming majority of the network is not going to get the new hardware in any reasonable timeframe.  </p>
<p class="font-claude-response-body break-words whitespace-normal leading-[1.7]">Some RTU vendors are beginning to adopt the modern data streaming methods we advocate — a positive development, but by definition it only extends to their own equipment. It's a difficult position when your business depends on hardware sales: advocating for an architecture that makes hardware interchangeable would undermine the core of what you sell. <strong>The implied solution remains: "Put our new solution in every site, and the problem will be solved."</strong></p>
<h2>When Hardware Is the Right Answer</h2>
<p class="font-claude-response-body break-words whitespace-normal leading-[1.7]">This argument is not anti-hardware, and it's worth being precise about that.</p>
<p class="font-claude-response-body break-words whitespace-normal leading-[1.7]">Some functions require specific hardware and nothing else will do. If you need video, you need a camera. If you need AC metering, you need an AC meter. If a remote site needs out-of-band connectivity, you need a modem. If you need more ethernet ports, you need a switch. If you need contact closure inputs or output relay control — to exercise a generator, for example — some form of RTU may be the right answer. In each case the hardware is justified by a specific function it uniquely provides, and the value of that function is the test.</p>
<p class="font-claude-response-body break-words whitespace-normal leading-[1.7]"><strong>What hardware should no longer be considered is the monitoring platform itself.</strong> Not because site hardware doesn't work well in isolation — some of it works quite well — but because deploying it unevenly as the data layer across a heterogeneous network is the decision that has produced three decades of fragmentation and the economics conversation operators are having right now.</p>
<hr>
<h2>Software Platforms Are Better — But Still a Silo</h2>
<p class="font-claude-response-body break-words whitespace-normal leading-[1.7]">What might seem like a reasonable solution to this problem is a hardware-agnostic, proprietary software platform. The pitch is reasonable: no hardware required, works with what you already have, modern interface.</p>
<p class="font-claude-response-body break-words whitespace-normal leading-[1.7]">The problem is subtler but structurally similar. These platforms may be hardware-agnostic on the input side, but they are not data-agnostic on the output side. Your data flows into their system in a proprietary format, queryable on their terms, subject to their pricing and their decisions about what you can and cannot do with information about your own network. That's before you factor in AI — if a more capable tool emerges, proprietary software becomes the thing standing between you and it.</p>
<p class="font-claude-response-body break-words whitespace-normal leading-[1.7]">There's an economic problem too. Hardware and software vendors both carry significant overhead that has nothing to do with your operational problem — manufacturing, firmware, proprietary development, support infrastructure. Those costs are embedded in what you pay. <strong>A company focused purely on the end goal of standardized site data and how to use it avoids that overhead entirely.</strong></p>
<p class="font-claude-response-body break-words whitespace-normal leading-[1.7]">What ClaritechIO provides is closer to what a telecom operator would build for themselves — if they had the time, the tolerance for trial and error, and the accumulated expertise. We aren't trying to shoehorn in proprietary tools to create vendor stickiness. The question we asked when founding this company was simple: <strong>what would we do if it was our own network? FOCUS is that answer.</strong> The goal isn't to make operators dependent on us — it's to impart the method and build something WITH the operator that is genuinely and lastingly valuable.</p>
<hr>
<h2>The Distinction That Actually Matters</h2>
<p class="font-claude-response-body break-words whitespace-normal leading-[1.7]">The right question isn't hardware versus software. It's whether you end up with a proprietary product or a dataset you own.</p>
<p class="font-claude-response-body break-words whitespace-normal leading-[1.7]">A proprietary product — hardware or software — gives you access to what the vendor built, on the vendor's terms. When a better tool comes along, or when AI systems need access to that data, you negotiate with the vendor. Or you don't get access at all.</p>
<p class="font-claude-response-body break-words whitespace-normal leading-[1.7]">A dataset you own is different in kind, not just degree. That dataset can feed Grafana dashboards, Snowflake, an AI optimization model, a billing system, a digital twin — anything that exists today, and anything built tomorrow. No permission required. No renegotiation. The data is yours and it goes where you decide.</p>
<p class="font-claude-response-body break-words whitespace-normal leading-[1.7]"><strong>This is what hardware and software agnostic actually means</strong> when it's real: not just flexibility in what the system ingests, but full ownership and portability of what it produces. The value of that portability compounds over time. Every new analytical capability, every new AI tool, every new application can be applied to the same dataset — without starting over.</p>
<hr>
<h2>What Different Economics Look Like</h2>
<p class="font-claude-response-body break-words whitespace-normal leading-[1.7]">FOCUS is a managed energy data layer — not a software license you configure yourself. ClaritechIO <strong>integrates with your existing equipment</strong>, standardizes data across every vendor format and protocol in your network, and delivers per-site and network-level dashboards, all maintained on an ongoing basis.  If you have all this intelligent equipment creating data, what is your plan for how that data will be used? Unlike an NMS tool that hands you a configuration problem, FOCUS delivers a working data layer from day one. </p>
<p class="font-claude-response-body break-words whitespace-normal leading-[1.7]">For a network of 1,000 sites, FOCUS can be implemented for several hundred dollars per site — integration, standardization, pipeline, and dashboarding included, deployed rapidly without disrupting current alarm systems or processes. That figure comes down further as site types get templated. More importantly, it replaces two expenditures operators have historically made sequentially: the hardware entry fee, and the data work that always had to follow.  <strong>FOCUS skips the first by working with equipment already in your network without needing an RTU as an intermediary device, and delivers the second.   </strong></p>
<p class="font-claude-response-body break-words whitespace-normal leading-[1.7]">Existing RTUs and legacy equipment are simply data sources. FOCUS normalizes what they produce alongside everything else in the network.  Your installed base of site monitoring tools finally starts delivering something closer to what it was always theoretically capable of.  </p>
<p class="font-claude-response-body break-words whitespace-normal leading-[1.7]">Unlike RTU-based approaches, where partial coverage collapses much of the value, FOCUS delivers meaningful data at any coverage level and improves as coverage expands. <strong>New sites and existing sites are addressed by the same layer simultaneously</strong>.</p>
<hr>
<h2 class="font-claude-response-body break-words whitespace-normal leading-[1.7]"><strong>An Approach That Works for Both New Sites and Legacy Sites</strong></h2>
<p class="font-claude-response-body break-words whitespace-normal leading-[1.7]">Designing the data layer for new cabinet specs is one problem. Bringing thousands of existing sites — already deployed, already heterogeneous, already paid for — into the same data standard is a different and larger one. Most new site architectures answer the first and ignore the second.</p>
<p class="font-claude-response-body break-words whitespace-normal leading-[1.7]"><strong>The only architecture that answers both simultaneously is one that sits above the hardware entirely</strong> — normalizing data regardless of what's underneath it, feeding it to whatever tools the operator chooses, owned by the operator rather than the vendor.</p>
<p class="font-claude-response-body break-words whitespace-normal leading-[1.7]">The economics align. The AI strategy aligns. The vendor lock-in question resolves. New builds and the legacy network are addressed at the same time.  Unlike hardware-based approaches that can't be cost-effectively scaled across every site type, the same data layer applies equally to your smallest edge sites and your largest data centers.</p>
<p class="font-claude-response-body break-words whitespace-normal leading-[1.7]">It is not a complicated argument, but it is one that you may not have heard because it works against existing voices in the industry, because it works directly against their current business models.</p>
<hr>
<div class="personal-note">
<h2>A Personal Note on Why This Matters</h2>
<p class="font-claude-response-body break-words whitespace-normal leading-[1.7]">I spent 25 years at an RTU company. I believed in what I was selling, and I still think the hardware we made was among the best in the industry, but along the way I reached a conclusion I couldn't talk myself out of.   The real problem — network-wide standardization, true telemetry at scale, data that could actually feed the analytical and AI tools operators were going to need — was never going to be solved from inside that model. Not because the hardware wasn't capable, but because the business model structurally couldn't allow it.</p>
<p class="font-claude-response-body break-words whitespace-normal leading-[1.7]"><strong>An RTU is a tool. Like any tool, it does nothing without the expertise to apply it correctly.</strong> What became clear over years of work using other tools alongside the RTUs I was selling — open-source data tools filled gaps, lived one layer above the hardware, made the economics of projects work, and delivered value the hardware alone couldn't.  Eventually we arrived at a point that we knew exactly how to build the best system, but somehow had to include an RTU as part of the project as that was our job. It was clear that expertise was really the fundamental product.</p>
<p>It became impossible to ignore that the more expensive proprietary hardware tools were actually getting in the way of applying that expertise to create the best possible solutions.</p>
<p class="font-claude-response-body break-words whitespace-normal leading-[1.7]">My co-founders and I left to build something that could solve the real problem. That's ClaritechIO, and that's FOCUS.</p>
</div>
<div class="cta-section">
<h2>Start With Five Sites</h2>
<p>A five-site trial with FOCUS lays the foundation for a 500, 5000, or 50000 site network.  A trial can answer the question every operator is now asking: <strong>is there actually something better?</strong></p>
<p>We can show FOCUS in a direct trial, on any network, with full confidence that we can show something better than today's solutions.</p>
<p><strong>Contact us to start a trial: <a href="mailto:sales@claritech.io">sales@claritech.io</a></strong></p>
</div>
</div>
<footer class="article-footer">
<p>ClaritechIO builds FOCUS, a managed energy data layer for telecom networks, data centers, tower companies, and mobile network operators.</p>
<p> </p>
</footer></article>
            ]]>
        </content>
    </entry>
    <entry>
        <title>Tower Companies Need a Data Strategy</title>
        <author>
            <name>Jon Baars</name>
        </author>
        <link href="https://www.claritech.io/towerco/"/>
        <id>https://www.claritech.io/towerco/</id>
        <media:content url="https://www.claritech.io/media/posts/42/PXL_20211208_201019720.jpg" medium="image" />
            <category term="All Articles"/>

        <updated>2026-05-01T16:10:45-07:00</updated>
            <summary type="html">
                <![CDATA[
                        <img src="https://www.claritech.io/media/posts/42/PXL_20211208_201019720.jpg" alt="" />
                    May 2026 ·Jon Baars Tower Companies Need a Data Strategy — Not Another Point Solution Towercos around the world have different SLA obligations, different infrastructure configurations, and very different relationships with their tenants, even within a single towerco. What they have in common is this:&hellip;
                ]]>
            </summary>
        <content type="html">
            <![CDATA[
                    <p><img src="https://www.claritech.io/media/posts/42/PXL_20211208_201019720.jpg" class="type:primaryImage" alt="" /></p>
                <nav></nav>
<article class="article-wrap">
<div class="article-meta">May 2026 <span class="sep">·</span>Jon Baars</div>
<h1 class="article-title">Tower Companies Need a Data Strategy — Not Another Point Solution</h1>
<p class="article-deck">Towercos around the world have different SLA obligations, different infrastructure configurations, and very different relationships with their tenants, even within a single towerco. What they have in common is this: every time they try and manage these operational obligations with a dedicated proprietary solution, they make the underlying problem harder to solve.</p>
<div class="article-body">
<h2>The Point Solution Trap</h2>
<p>A towerco identifies a specific operational need. Maybe it is AC metering — they need to understand power consumption at their sites to manage energy costs. So they deploy an AC metering solution, likely with its own modem connection. </p>
<p>A year later, the same towerco needs IP cameras at some remote sites for security, or a diesel fuel probe for accurate diesel fuel measurements, or rectifier information.   They might get a camera solution from a security vendor, an IoT solution for fuel monitoriing, and an element management software from a particular rectifier vendor.</p>
<p>A year after that, a major tenant negotiates for energy billing — they want to pay for what they consume rather than a flat rate. The towerco works to deploy a billing method.</p>
<p>Maybe the towerco recognizes the downsides to using single point solutions, and an attempt is made to consolidate point solutions using hardware-based RMS (Remote Monitoring Systems), RTU, or other broad-based software solutions.   These might be better, at least an intermediate step at reducing the number of modem connections to the site, but have various problems, fundamentally in what they don't solve.</p>
<p>These solutions are how data silos are built, not through bad decisions, but through a series of locally reasonable ones. Maybe each of the systems described above solved a real problem, but the collective result is fragmentation that makes every subsequent problem harder to solve, because each new need now has to navigate around the silos that already exist.   Every tower company and telecom operator without the luxury of building a network from scratch suffers from this problem.</p>
<p>It is like accumulated debt.  Ultimately the goal is standardization, and this debt will have to be paid sooner or later if operators really want to solve the operational problems in their networks.  </p>
<h2>What a Data Strategy Changes</h2>
<p>Unlike point solutions, a towerco data strategy doesn't start with an immediate operational problem. It starts with different questions: what mix of equipment and data is already available in my network, what point solutions have I tried, and do I have site network connectivity?</p>
<p>For a grass-and-steel towerco, this data strategy might initially need to answer only a handful of questions: grid power status, basic site availability, anomalies that warrant attention. Simple obligations, simple data needs, but the foundation should still be built to expand, because the obligations won't stay simple forever.</p>
<p>For a managed infrastructure towerco, the data foundation needs to support more: power delivery metrics, backup performance tracking, cooling status, potentially renewable energy contribution and management. These are the inputs to the KPI calculations — Power Availability, Power Backup, Cooling Availability — that define SLA compliance in this model. The specific KPIs that matter depend on what the towerco has committed to its tenants. The data foundation that makes them measurable is the same regardless.</p>
<p>The point solutions a towerco would otherwise purchase to address each of these needs individually become applications of the data foundation rather than separate systems creating separate datasets.  Standardized site data can be combined together in different ways or with external data like energy tariffs to deliver many additional functions, like energy billing.  Each additional use is made possible by the SAME underlying data created as part of your overall site data strategy.</p>
<h2>Why It Matters Now</h2>
<p>The argument for a data strategy over point solutions has always been sound. What has changed in 2026 is the availability of open-source tools that can create standardized data cost effectively, and the arrival of AI that will only operate on standardized data.</p>
<p>Every point solution deployed today creates a data silo that is, by design, inaccessible to AI systems that were not part of that vendor's ecosystem. An AC metering platform that does not expose its data in a standardized format is not just a monitoring limitation, it is a barrier to every future optimization algorithm, anomaly detection model, and predictive maintenance system that will want to consume that data.</p>
<p>Towercos purchasing point solutions today are not just creating integration debt for their current operations. They are making a bet about the future of their data: either that they will never want AI systems to have access to it, or that their current vendors are more suited to manage any AI usage on their data than they are themselves. That is an increasingly difficult bet to justify.</p>
<p>A data strategy built on open, normalized, vendor-agnostic telemetry that is owned by the customer has essentially unlimited upside as AI tooling matures. You could expect to gather 50-100 energy and other parameters per minute from every tower location in your network, and this data has value.   A massive, standardized, growing, historical dataset grows more valuable over time, not less, and if you have a large head start on your competitors, the value is even larger.</p>
<h2>The Practical Path Forward</h2>
<p>The data strategy approach does not require replacing equipment that already exists in your network. In most towerco environments, the equipment that can supply the right data is already deployed, including all the point solutions mentioned above, as well as modern rectifiers, battery management systems, environmental sensors, and power distribution equipment that has been capable of producing granular telemetry for years.  <strong>New open-source tools (and knowledge of how to use them) standardize that data without asking the towerco to rip out and replace anything.</strong></p>
<p>A proper data strategy is additive, not disruptive. Whatever alarm and monitoring infrastructure a towerco has invested in, whatever NOC processes and ticketing workflows have been built around existing systems that are working well, those stay in place. The data layer operates alongside them, providing the foundation that existing systems were never designed to deliver, and could even supply data back into these same systems.  Personnel in your organization are able to help work with this data.  It is a path to your organization and personnel building AI-related skills and advantages.  A provider of a data strategy and standardized data, like ClaritechIO, is not a gatekeeper to the use of the data.   The data is ultimately yours.   </p>
<p>You benefit from the ability to answer new questions from a single, expanding foundation, without deploying a new silo every time a new question arises.  If you want to deploy cameras, then the answer is to just examine how video fits into this data strategy.  If you want to buy PV gear, generators, rectifiers, or cooling equipment, you can purchase the equipment from <strong>whatever vendor you believe gives you the best value</strong>, as you aren't tied to any particular equipment's management interface.   The data strategy is fundamentally built on an ability to work with any equipment. <br><br>You don't cede control of key elements of managing your network to vendors who benefit from the siloing of your data as a form of vendor lock-in. </p>
<p>That is the practical difference between a data strategy and another proprietary monitoring purchase.  These benefits will compound in favor of the operators who make it early, and it is somewhat ironic that <strong>pursuing this data strategy path will cost less than continuing to buy point solutions</strong> that are never going to deliver what you're hoping for due to the data silo problems mentioned above.   It is a much better solution at a lower cost.</p>
</div>
<!-- /.article-body -->
<div class="article-cta">
<p>ClaritechIO builds the data normalization layer that makes towerco KPI measurement, SLA and ESG compliance reporting, and energy billing possible — across whatever infrastructure is already deployed, without requiring hardware replacement.</p>
<p> </p>
<a href="mailto:hello@claritech.io">Talk with us → sales@claritech.io</a></div>
<div class="article-author">
<div>
<div class="author-name">Jon Baars</div>
<div>Co-founder, ClaritechIO · 25 years in telecom infrastructure monitoring</div>
</div>
</div>
</article>
<footer>
<p><a href="https://www.claritech.io/">claritech.io</a>  ·  <a href="mailto:hello@claritech.io">sales@claritech.io</a>  ·  Seattle, WA</p>
<p style="margin-top: 0.5rem;">© 2026 ClaritechIO. All rights reserved.</p>
</footer>
            ]]>
        </content>
    </entry>
    <entry>
        <title>This Network Energy Data Has Never Existed Before</title>
        <author>
            <name>Jon Baars</name>
        </author>
        <link href="https://www.claritech.io/the-network-energy-data-that-has-never-existed-before/"/>
        <id>https://www.claritech.io/the-network-energy-data-that-has-never-existed-before/</id>
        <media:content url="https://www.claritech.io/media/posts/40/AZ2r0dSSvb9h7lB3pH3C6g-AZ2r0dSSqozXFBsJvr_G1A.jpg" medium="image" />
            <category term="All Articles"/>

        <updated>2026-04-16T17:06:09-07:00</updated>
            <summary type="html">
                <![CDATA[
                        <img src="https://www.claritech.io/media/posts/40/AZ2r0dSSvb9h7lB3pH3C6g-AZ2r0dSSqozXFBsJvr_G1A.jpg" alt="" />
                    Energy efficiency · Network infrastructure · Data strategy Jon Baars · April 2026 There is something at the center of what we do at ClaritechIO that is frequently misunderstood. The energy telemetry data we produce does not already exist somewhere. It isn't waiting to be&hellip;
                ]]>
            </summary>
        <content type="html">
            <![CDATA[
                    <p><img src="https://www.claritech.io/media/posts/40/AZ2r0dSSvb9h7lB3pH3C6g-AZ2r0dSSqozXFBsJvr_G1A.jpg" class="type:primaryImage" alt="" /></p>
                <div style="max-width: 680px; margin: 0 auto; padding: 3rem 1.5rem 4rem;"><!-- Label -->
<p style="font-family: 'DM Sans',sans-serif; font-size: 11px; font-weight: 500; letter-spacing: 0.12em; text-transform: uppercase; color: #1d9e75; margin: 0 0 1rem;">Energy efficiency · Network infrastructure · Data strategy</p>
<!-- Title --><!-- Byline -->
<p style="font-family: 'DM Sans',sans-serif; font-size: 13px; color: #999; font-weight: 300; margin: 0 0 2.5rem;">Jon Baars  ·  April 2026</p>
<!-- Lede -->
<p style="font-family: 'DM Sans',sans-serif; font-size: 18px; line-height: 1.65; color: #555; margin: 0 0 2rem; font-weight: 300; border-left: 3px solid #1D9E75; padding-left: 1rem;">There is something at the center of what we do at ClaritechIO that is frequently misunderstood. The energy telemetry data we produce <strong>does not already exist somewhere</strong>.  It isn't waiting to be moved or cleaned. It isn't billing data from an energy company, and it is not legacy energy management output from a proprietary hardware or software system. <strong>We are creating standardized energy telemetry that has never existed before.</strong></p>
<!-- Body -->
<h2 style="font-family: 'DM Serif Display',serif; font-size: 26px; font-weight: 400; color: #111; margin: 2.75rem 0 1rem;">The Equipment Has Been There. The Data Hasn't.</h2>
<p style="font-family: 'DM Sans',sans-serif; font-size: 16px; line-height: 1.85; color: #222; margin: 0 0 1.25rem;">In any data center or telecom site built in the last twenty years, equipment has been designed to report granular operational data: SNMP-capable generator or rectifier controllers, power distribution units with management interfaces, AC meters, environmental sensors, battery management systems, cooling systems with digital controls, and various proprietary and partial solutions like RTU and IoT units.</p>
<p style="font-family: 'DM Sans',sans-serif; font-size: 16px; line-height: 1.85; color: #222; margin: 0 0 1.25rem;">Most of this equipment has been capable of reporting valuable data all along — rack-level power draw, load percentages per circuit, supply air temperatures, rectifier loads or generator fuel levels. Hundreds of variables, minute by minute, if you use the right tools.</p>
<!-- Callout box -->
<div style="background: #E1F5EE; border-left: 3px solid #0F6E56; border-radius: 0 8px 8px 0; padding: 1.25rem 1.5rem; margin: 1.75rem 0;">
<p style="font-family: 'DM Sans',sans-serif; margin: 0; font-size: 15px; line-height: 1.75; color: #1a1a1a;">In the past, nothing was asking this equipment the right questions, in the right way, consistently, <strong>across vendors</strong>, at scale. The data streaming layer that standardizes and collects all of this simply wasn't there. That is the problem ClaritechIO exists to solve.</p>
</div>
<!-- H2 -->
<h2 style="font-family: 'DM Serif Display',serif; font-size: 26px; font-weight: 400; color: #111; margin: 2.75rem 0 1rem;">This Is Not a Data Pipeline Problem</h2>
<p style="font-family: 'DM Sans',sans-serif; font-size: 16px; line-height: 1.85; color: #222; margin: 0 0 1.25rem;">Companies like Confluent, Snowflake, Cloudera and the broader modern data stack are excellent at what they do. They move data faster, store it more securely, unsilo it, and make it more accessible.  Every company is faced with the problems related to the <em>existing</em> data in their organizations.</p>
<p style="font-family: 'DM Sans',sans-serif; font-size: 16px; line-height: 1.85; color: #222; margin: 0 0 1.25rem;"><strong>ClaritechIO is solving a data <em>creation</em> problem</strong>. The granular, standardized, equipment-level, real-time energy telemetry we produce has no predecessor in operator environments. There is no historical version of it sitting in an aging SQL database. There is no slower batch process we are speeding up.  None of the existing proprietary hardware and software tools you have are creating it.  <strong>This data simply did not exist before modern data-streaming methodologies recently enabled it.</strong></p>
<p style="font-family: 'DM Sans',sans-serif; font-size: 16px; line-height: 1.85; color: #222; margin: 0 0 1.25rem;">The tools that make our work possible are the same tools the modern data stack is built on, but the work is fundamentally different. These are complementary systems, not competing ones.   The data ClaritechIO produces can and should flow directly into the platforms the companies mentioned above provide, giving them a valuable new dataset while also giving users built-in infrastructure and access to AI tooling.   </p>
<!-- H2 -->
<h2 style="font-family: 'DM Serif Display',serif; font-size: 26px; font-weight: 400; color: #111; margin: 2.75rem 0 1rem;">What Gets Created, Specifically</h2>
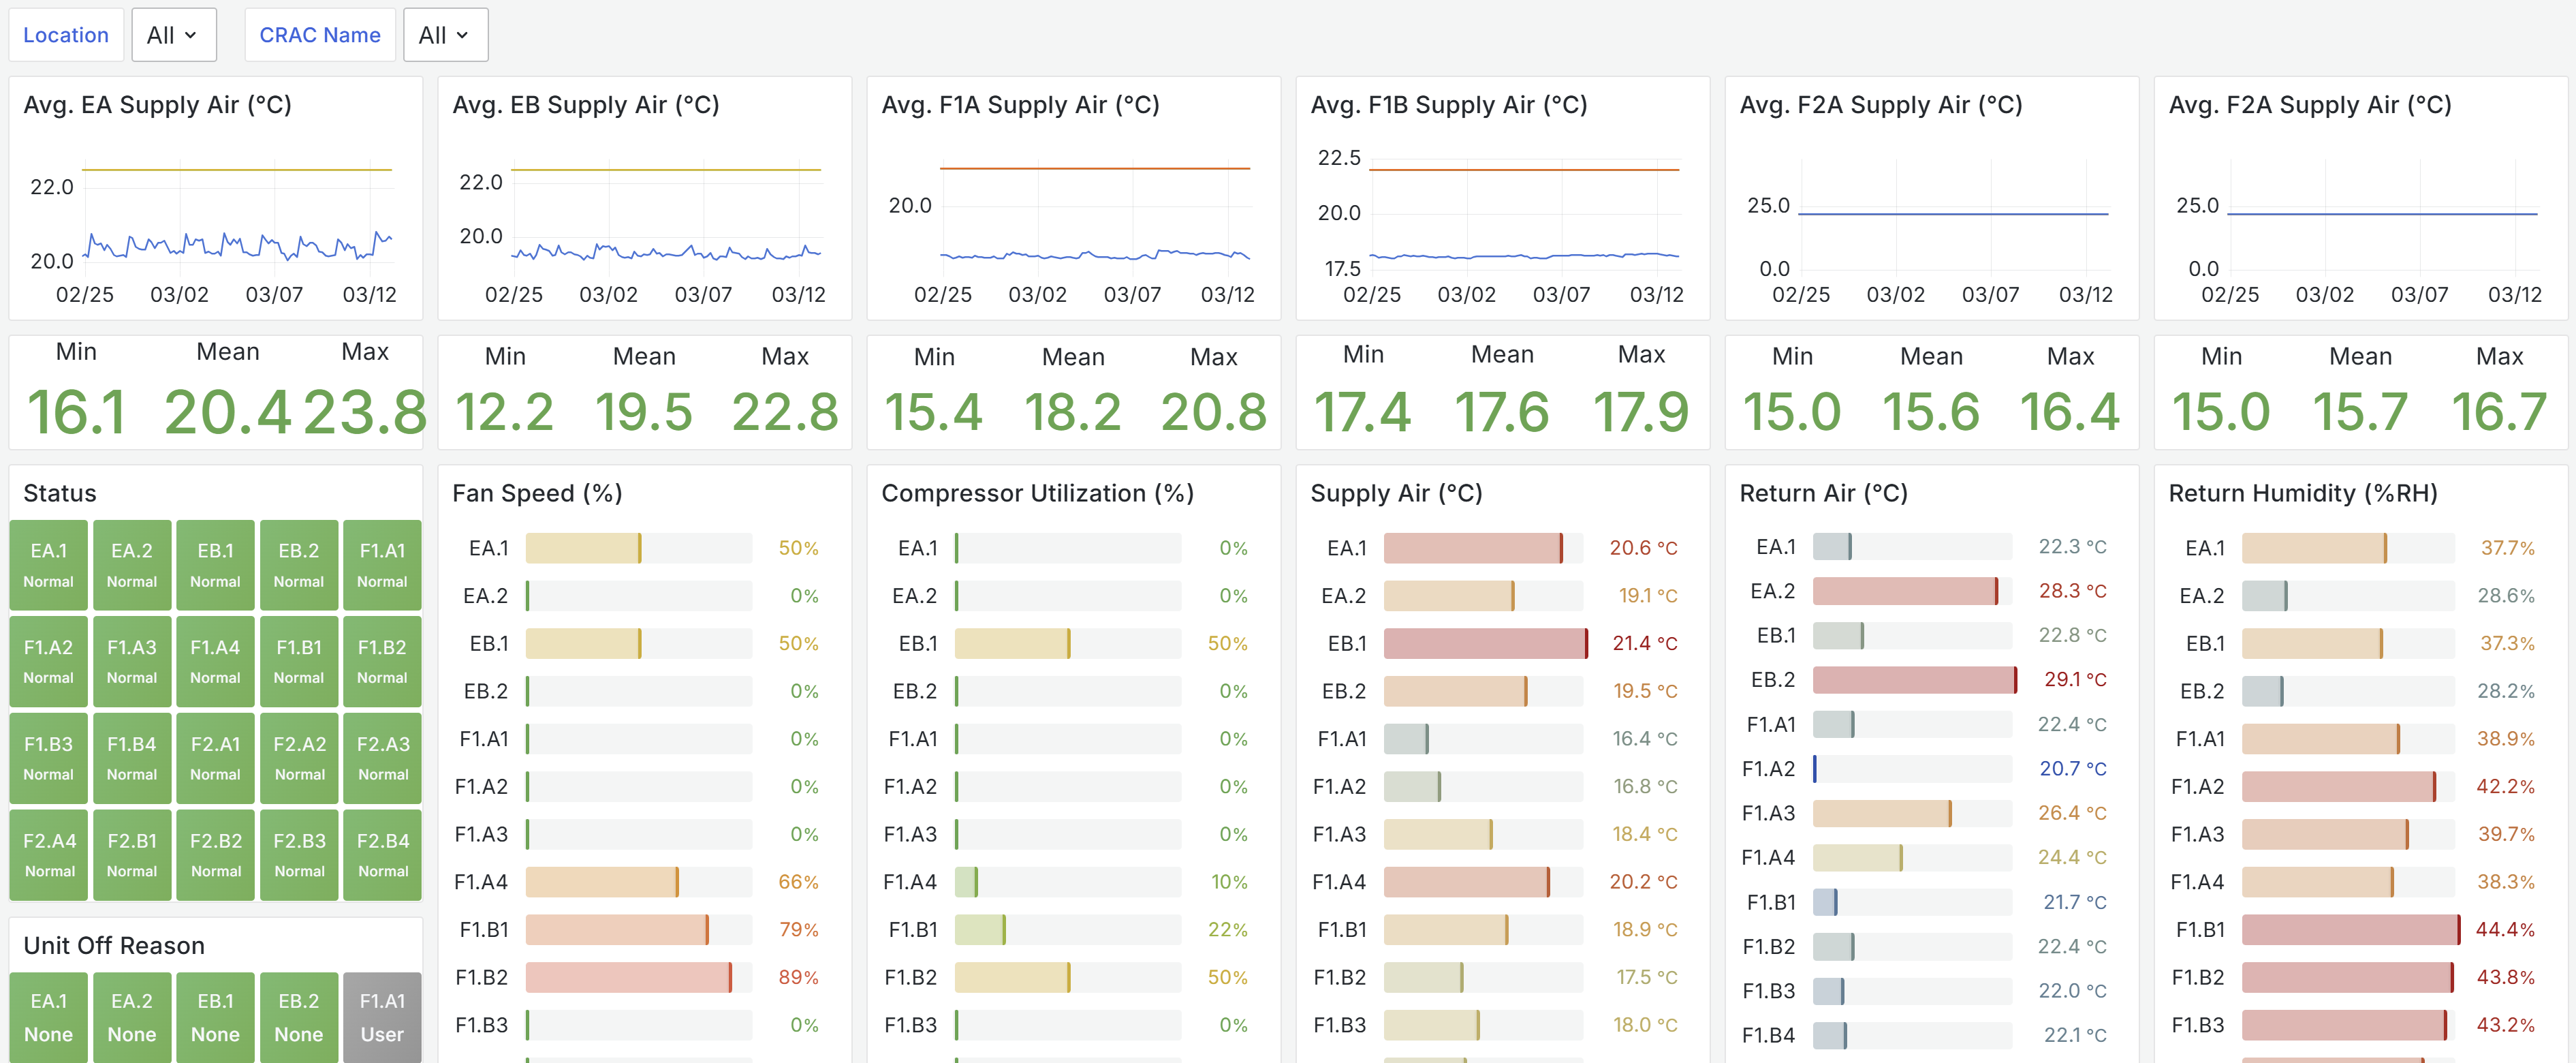
<p style="font-family: 'DM Sans',sans-serif; font-size: 16px; line-height: 1.85; color: #222; margin: 0 0 1.25rem;">For example, in a typical data center deployment, FOCUS ingests data from power distribution units to standardize rack-level power draw and load percentage across every circuit and every PDU vendor in the facility. It collects supply and return air temperatures, fan speeds, compressor utilization, and humidity from every CRAC/CRAH in the building. It captures UPS output load across phases, generator status and fuel levels, and facility-wide environmental sensing, standardized across multiple vendors to a common schema by equipment class, streaming continuously.</p>
<!-- Question cards — same pattern as existing post -->
<div style="display: grid; gap: 10px; margin: 1.5rem 0;">
<div style="display: flex; gap: 12px; align-items: flex-start; background: #f7f7f5; border-radius: 8px; padding: 12px 14px;">
<div style="width: 20px; height: 20px; border-radius: 50%; background: #E1F5EE; flex-shrink: 0; margin-top: 3px;"> </div>
<span style="font-family: 'DM Sans',sans-serif; font-size: 14px; line-height: 1.6; color: #222;">For telecom networks, this scales across hundreds or thousands of cell sites, each reporting vendor-agnostic, standardized data at one-minute intervals.</span></div>
<div style="display: flex; gap: 12px; align-items: flex-start; background: #f7f7f5; border-radius: 8px; padding: 12px 14px;">
<div style="width: 20px; height: 20px; border-radius: 50%; background: #E1F5EE; flex-shrink: 0; margin-top: 3px;"> </div>
<span style="font-family: 'DM Sans',sans-serif; font-size: 14px; line-height: 1.6; color: #222;">The result is not a dashboard. It is a <strong>dataset.   </strong>A persistent, growing, normalized record of infrastructure energy behavior that did not exist before.</span></div>
<div style="display: flex; gap: 12px; align-items: flex-start; background: #f7f7f5; border-radius: 8px; padding: 12px 14px;">
<div style="width: 20px; height: 20px; border-radius: 50%; background: #E1F5EE; flex-shrink: 0; margin-top: 3px;"> </div>
<span style="font-family: 'DM Sans',sans-serif; font-size: 14px; line-height: 1.6; color: #222;">AI models, benchmarking systems, digital twin environments, and optimization algorithms can all consume it. The aggregated energy picture across networks of this scale has never existed before.</span></div>
</div>
<!-- H2 -->
<h2 style="font-family: 'DM Serif Display',serif; font-size: 26px; font-weight: 400; color: #111; margin: 2.75rem 0 1rem;">Data Value Compounds Over Time</h2>
<p style="font-family: 'DM Sans',sans-serif; font-size: 16px; line-height: 1.85; color: #222; margin: 0 0 1.25rem;">A single cell site measured with FOCUS produces roughly 100 normalized energy metrics every minute. At 10,000 cell sites, a carrier would produce 1 million data points per minute — roughly 500 billion per year. Twenty larger telecom data center facilities producing 30 thousand data points per minute could contribute another 300 billion annually.</p>
<!-- Stats grid — same pattern as existing post -->
<div style="display: grid; grid-template-columns: 1fr 1fr; gap: 1px; background: #e8e8e8; border-radius: 10px; overflow: hidden; margin: 1.75rem 0;">
<div style="background: #f7f7f5; padding: 1.5rem; text-align: center;"><span style="font-family: 'DM Serif Display',serif; font-size: 36px; color: #0f6e56; display: block;">500B</span> <span style="font-family: 'DM Sans',sans-serif; font-size: 13px; color: #777; margin-top: 6px; display: block; line-height: 1.45;">data points per year at 10,000 cell sites</span></div>
<div style="background: #f7f7f5; padding: 1.5rem; text-align: center;"><span style="font-family: 'DM Serif Display',serif; font-size: 36px; color: #0f6e56; display: block;">+300B</span> <span style="font-family: 'DM Sans',sans-serif; font-size: 13px; color: #777; margin-top: 6px; display: block; line-height: 1.45;">additional points annually per 20 telecom data center facilities</span></div>
</div>
<p style="font-family: 'DM Sans',sans-serif; font-size: 16px; line-height: 1.85; color: #222; margin: 0 0 1.25rem;">But the more important fact is not the volume.  The methodology described would work equally as well in a 100 site telecom network, or a single data center.   What is important is that these data points did not exist before. FOCUS doesn't look at existing data in a new way. <strong>It causes this data to exist.</strong></p>
<p style="font-family: 'DM Sans',sans-serif; font-size: 16px; line-height: 1.85; color: #222; margin: 0 0 1.25rem;">A week of normalized telemetry lets you find outliers. A month lets you establish baselines. A year reveals seasonal patterns and validates whether efficiency interventions — like RRU power-saving features — are actually working. Multiple years enable predictive work: forecasting equipment behavior, anticipating failures, building the training data that AI optimization models will need to become genuinely useful.   You gain value very rapidly and the value grows over time.</p>
<p style="font-family: 'DM Sans',sans-serif; font-size: 16px; line-height: 1.85; color: #222; margin: 0 0 1.25rem;"><strong><em>An operator who begins building this dataset today will have years of normalized, structured, queryable history by the time AI-driven infrastructure optimization matures into standard practice. An operator who waits will be starting from scratch at exactly the moment when that history will be most valuable.</em></strong></p>
<!-- H2 -->
<h2 style="font-family: 'DM Serif Display',serif; font-size: 26px; font-weight: 400; color: #111; margin: 2.75rem 0 1rem;">The AI Connection Is Direct, Not Aspirational</h2>
<p style="font-family: 'DM Sans',sans-serif; font-size: 16px; line-height: 1.85; color: #222; margin: 0 0 1.25rem;">There is a lot of discussion in infrastructure circles about AI-driven operations — autonomous optimization, predictive maintenance, intelligent energy management. Most of it is framed as a future capability.</p>
<p style="font-family: 'DM Sans',sans-serif; font-size: 16px; line-height: 1.85; color: #222; margin: 0 0 1.25rem;">The limiting factor, in almost every case, is not the AI. It is the underlying data. Specifically, the absence of normalized, granular, time-series infrastructure data that AI systems need to do anything useful. Standardized telemetry is the prerequisite without which AI-driven energy optimization remains theoretical.</p>
<!-- H2 -->
<h2 style="font-family: 'DM Serif Display',serif; font-size: 26px; font-weight: 400; color: #111; margin: 2.75rem 0 1rem;">Where We Are</h2>
<p style="font-family: 'DM Sans',sans-serif; font-size: 16px; line-height: 1.85; color: #222; margin: 0 0 1.25rem;">This is not theoretical.   The datasets we have built for customers span years in some cases and already contain billions of standardized energy records. The normalization approach works across heterogeneous equipment from different vendors, at different ages, using different protocols, across every site in your network.  </p>
<p style="font-family: 'DM Sans',sans-serif; font-size: 16px; line-height: 1.85; color: #222; margin: 0 0 1.25rem;">Energy costs are rising. Sustainability mandates are tightening. AI infrastructure is driving power demand to levels that make efficiency a strategic rather than operational concern. <strong>The competitive window in which not having a viable network energy data strategy is closing.</strong></p>
<!-- Callout box -->
<div style="background: #085041; border-radius: 12px; padding: 2.25rem 2rem; margin-top: 3rem;">
<h2 style="font-family: 'DM Serif Display',serif; font-size: 24px; font-weight: 400; color: #9fe1cb; margin: 0 0 0.75rem;">The data foundation matters more right now than the tools layered on top of it</h2>
<p style="font-family: 'DM Sans',sans-serif; font-size: 15px; line-height: 1.75; color: #9fe1cb; margin: 0 0 1.5rem; opacity: 0.85;">ClaritechIO builds the standardized energy data foundation that drives real efficiency gains and enables AI-driven data center and telecom infrastructure operations. If this resonates with problems you are working on, we would like to talk.</p>
<p style="font-family: 'DM Sans',sans-serif; font-size: 14px; font-weight: 500; color: #9fe1cb; margin: 0; opacity: 0.7;"><a href="mailto:jon.baars@claritech.io" style="color: #9fe1cb;">jon.baars@claritech.io</a>  ·  <a href="https://www.claritech.io" style="color: #9fe1cb;">www.claritech.io</a></p>
</div>
</div>
            ]]>
        </content>
    </entry>
    <entry>
        <title>The Network Energy Data Problem</title>
        <author>
            <name>Jon Baars</name>
        </author>
        <link href="https://www.claritech.io/the-energy-data-problem-2/"/>
        <id>https://www.claritech.io/the-energy-data-problem-2/</id>
        <media:content url="https://www.claritech.io/media/posts/39/A-cinematic-top-down-aerial-view-of-a-sprawling-data-center-campus-at-dusk-with-multiple-server-buildings-connected-by-glowing-fiber-optic-lines.-Some-lines-are-fragmented-and-disconnected-shown-in-cool-gray-and-white.-A-single-convergin.jpg" medium="image" />
            <category term="All Articles"/>

        <updated>2026-04-03T14:47:48-07:00</updated>
            <summary type="html">
                <![CDATA[
                        <img src="https://www.claritech.io/media/posts/39/A-cinematic-top-down-aerial-view-of-a-sprawling-data-center-campus-at-dusk-with-multiple-server-buildings-connected-by-glowing-fiber-optic-lines.-Some-lines-are-fragmented-and-disconnected-shown-in-cool-gray-and-white.-A-single-convergin.jpg" alt="" />
                    Energy efficiency · Network infrastructure Hardware upgrades get all the attention. But your biggest efficiency opportunity might be sitting in siloed, unusable data you already have. Energy improvement conversations for telecom networks and data centers almost always start with hardware: more efficient servers, radios with&hellip;
                ]]>
            </summary>
        <content type="html">
            <![CDATA[
                    <p><img src="https://www.claritech.io/media/posts/39/A-cinematic-top-down-aerial-view-of-a-sprawling-data-center-campus-at-dusk-with-multiple-server-buildings-connected-by-glowing-fiber-optic-lines.-Some-lines-are-fragmented-and-disconnected-shown-in-cool-gray-and-white.-A-single-convergin.jpg" class="type:primaryImage" alt="" /></p>
                <p style="font-family: 'DM Sans',sans-serif; font-size: 11px; font-weight: 500; letter-spacing: 0.12em; text-transform: uppercase; color: #1d9e75; margin: 0 0 1rem;">Energy efficiency · Network infrastructure</p>
<p style="font-family: 'DM Sans',sans-serif; font-size: 18px; line-height: 1.65; color: #555; margin: 0 0 2rem; font-weight: 300; border-left: 3px solid #1D9E75; padding-left: 1rem;">Hardware upgrades get all the attention. But your biggest efficiency opportunity might be sitting in siloed, unusable data you already have.</p>
<p style="font-family: 'DM Sans',sans-serif; font-size: 16px; line-height: 1.85; color: #222; margin: 0 0 1.25rem;">Energy improvement conversations for telecom networks and data centers almost always start with hardware: more efficient servers, radios with advanced energy-saving features, smarter cooling, hybrid power solutions, added metering. These are real opportunities — but there's something being overlooked.</p>
<div style="display: grid; gap: 10px; margin: 1.5rem 0;">
<div style="display: flex; gap: 12px; align-items: flex-start; background: #f7f7f5; border-radius: 8px; padding: 12px 14px;">
<div style="width: 20px; height: 20px; border-radius: 50%; background: #E1F5EE; display: flex; align-items: center; justify-content: center; flex-shrink: 0; margin-top: 3px;"> </div>
<span style="font-family: 'DM Sans',sans-serif; font-size: 14px; line-height: 1.6; color: #222;">What if you could see energy usage data from every rack or every site — even data from different vendor's equipment — in one standardized form?</span></div>
<div style="display: flex; gap: 12px; align-items: flex-start; background: #f7f7f5; border-radius: 8px; padding: 12px 14px;">
<div style="width: 20px; height: 20px; border-radius: 50%; background: #E1F5EE; display: flex; align-items: center; justify-content: center; flex-shrink: 0; margin-top: 3px;"> </div>
<span style="font-family: 'DM Sans',sans-serif; font-size: 14px; line-height: 1.6; color: #222;">What if you could accurately compare every site in your network, including both your oldest brownfield sites and your newest greenfield sites?</span></div>
<div style="display: flex; gap: 12px; align-items: flex-start; background: #f7f7f5; border-radius: 8px; padding: 12px 14px;">
<div style="width: 20px; height: 20px; border-radius: 50%; background: #E1F5EE; display: flex; align-items: center; justify-content: center; flex-shrink: 0; margin-top: 3px;"> </div>
<span style="font-family: 'DM Sans',sans-serif; font-size: 14px; line-height: 1.6; color: #222;">What if you could calculate PUE and other derived metrics across your entire network minute-by-minute automatically?</span></div>
</div>
<div style="background: #E1F5EE; border-left: 3px solid #0F6E56; border-radius: 0 8px 8px 0; padding: 1.25rem 1.5rem; margin: 1.75rem 0;">
<p style="font-family: 'DM Sans',sans-serif; margin: 0; font-size: 15px; line-height: 1.75; color: #1a1a1a;">Most operators can't do any of this today — not because the equipment can't provide useful data, but because the energy telemetry data isn't usable in its current form.</p>
</div>
<h2 style="font-family: 'DM Serif Display',serif; font-size: 26px; font-weight: 400; color: #111; margin: 2.75rem 0 1rem;">Why The Data Silo Problem Persists</h2>
<p style="font-family: 'DM Sans',sans-serif; font-size: 16px; line-height: 1.85; color: #222; margin: 0 0 1.25rem;">The cause is straightforward. Equipment vendors compete on capability, so energy measurement, if it exists at all, feeds into proprietary management interfaces. Each vendor's data lives in its own world as vendor's try and differentiate themselves. Until recently, the tools to break down these silos simply didn't exist at a practical cost, and the proprietary tools that DID exist were themselves just new proprietary siloes of data.</p>
<h2 style="font-family: 'DM Serif Display',serif; font-size: 26px; font-weight: 400; color: #111; margin: 2.75rem 0 1rem;">What Siloed Data Actually Costs You</h2>
<p style="font-family: 'DM Sans',sans-serif; font-size: 16px; line-height: 1.85; color: #222; margin: 0 0 1.25rem;">This isn't a theoretical problem. Siloed energy data prevents real energy management and creates real, compounding costs:</p>
<ul style="list-style: none; padding: 0; margin: 0 0 1.25rem;">
<li style="font-family: 'DM Sans',sans-serif; font-size: 15px; line-height: 1.75; color: #222; padding: 10px 0 10px 2rem; border-bottom: 1px solid #e8e8e8; position: relative;">Hardware investments intended to improve energy usage are made against assumed ROI you can't verify.</li>
<li style="font-family: 'DM Sans',sans-serif; font-size: 15px; line-height: 1.75; color: #222; padding: 10px 0 10px 2rem; border-bottom: 1px solid #e8e8e8; position: relative;"><strong> ESG disclosures or GSMA benchmarks</strong> are educated guesses or expensive manual exercises.  </li>
<li style="font-family: 'DM Sans',sans-serif; font-size: 15px; line-height: 1.75; color: #222; padding: 10px 0 10px 2rem; border-bottom: 1px solid #e8e8e8; position: relative;">Without energy capacity data, over- and under-sizing of equipment perpetuates inefficiency.</li>
<li style="font-family: 'DM Sans',sans-serif; font-size: 15px; line-height: 1.75; color: #222; padding: 10px 0 10px 2rem; border-bottom: 1px solid #e8e8e8; position: relative;"><span style="color: #222222;">Outlier sites, which are obvious with data, can operate inefficiently for months or years.</span></li>
<li style="font-family: 'DM Sans',sans-serif; font-size: 15px; line-height: 1.75; color: #222; padding: 10px 0 10px 2rem; border-bottom: 1px solid #e8e8e8; position: relative;">Datacenter staff lose hours every month manually compiling customer energy reports and customer billing.</li>
<li style="font-family: 'DM Sans',sans-serif; font-size: 15px; line-height: 1.75; color: #222; padding: 10px 0 10px 2rem; position: relative;"><strong> Siloed data is working directly against your organization's AI readiness goals</strong>.</li>
</ul>
<p style="font-family: 'DM Sans',sans-serif; font-size: 16px; line-height: 1.85; color: #222; margin: 0 0 1.25rem;">Every cycle without solving this is a cycle where real efficiency gets pushed to "someday" — the next refresh, a new platform, the next budget cycle. Every proprietery tool added simply compounds the problem, and most proprietary tools can't work backwards to your existing sites as it runs counter to the need to compete and sell new hardware.</p>
<h2 style="font-family: 'DM Serif Display',serif; font-size: 26px; font-weight: 400; color: #111; margin: 2.75rem 0 1rem;">The CFO Question</h2>
<p style="font-family: 'DM Sans',sans-serif; font-size: 16px; line-height: 1.85; color: #222; margin: 0 0 1.25rem;">If your CFO asked tomorrow how much you're spending on energy, whether your efficiency metrics are actually improving, and which specific energy efficiency actions are having the biggest impact, how long would an honest answer take?</p>
<p style="font-family: 'DM Sans',sans-serif; font-size: 16px; line-height: 1.85; color: #222; margin: 0 0 1.25rem;">Now consider what becomes possible with standardized energy telemetry at scale:</p>
<div style="display: grid; grid-template-columns: 1fr 1fr; gap: 1px; background: #e8e8e8; border-radius: 10px; overflow: hidden; margin: 1.75rem 0;">
<div style="background: #f7f7f5; padding: 1.5rem; text-align: center;"><span style="font-family: 'DM Serif Display',serif; font-size: 36px; color: #0f6e56; display: block;">30K</span> <span style="font-family: 'DM Sans',sans-serif; font-size: 13px; color: #777; margin-top: 6px; display: block; line-height: 1.45;">standardized measurements per minute from data center locations</span></div>
<div style="background: #f7f7f5; padding: 1.5rem; text-align: center;"><span style="font-family: 'DM Serif Display',serif; font-size: 36px; color: #0f6e56; display: block;">100</span> <span style="font-family: 'DM Sans',sans-serif; font-size: 13px; color: #777; margin-top: 6px; display: block; line-height: 1.45;">measurements per minute from every cell tower in your network</span></div>
</div>
<p style="font-family: 'DM Sans',sans-serif; font-size: 16px; line-height: 1.85; color: #222; margin: 0 0 1.25rem;">Outliers become visible. Benchmark adherence becomes measurable. Investment decisions become defensible.  AI optimization stops being a future ambition and becomes something you can act on today.   The more of this data you collect, <strong>and we have collections of years of data in some cases</strong>, the more valuable it becomes. </p>
<div style="background: #E1F5EE; border-left: 3px solid #0F6E56; border-radius: 0 8px 8px 0; padding: 1.25rem 1.5rem; margin: 1.75rem 0;">
<p style="font-family: 'DM Sans',sans-serif; margin: 0; font-size: 15px; line-height: 1.75; color: #1a1a1a;">Unlike most infrastructure investments, this one doesn't require new hardware or a platform overhaul. The open-source data streaming tools required are mature, cost-effective, and likely are already deployed in your organization.   In many cases, creating this new data improves the ROI of AI investments already being made in your organization to improve customer experience or network reliability.</p>
</div>
<h2 style="font-family: 'DM Serif Display',serif; font-size: 26px; font-weight: 400; color: #111; margin: 2.75rem 0 1rem;">An Investment That's Likely Inevitable</h2>
<p style="font-family: 'DM Sans',sans-serif; font-size: 16px; line-height: 1.85; color: #222; margin: 0 0 1.25rem;">Simply bringing your sites closer to benchmark adherence and identifying outliers can pay for this work on its own.  Doing this work probably brings you into excellent alignment with your organizations overall data strategy.   The data infrastructure that makes this possible is fast to deploy, and the payoff — in visibility, efficiency, and AI readiness — is disproportionate to the investment.</p>
<div style="background: #085041; border-radius: 12px; padding: 2.25rem 2rem; margin-top: 3rem;">
<h2 style="font-family: 'DM Serif Display',serif; font-size: 24px; font-weight: 400; color: #9fe1cb; margin: 0 0 0.75rem;">Every network operator should be doing this</h2>
<p style="font-family: 'DM Sans',sans-serif; font-size: 15px; line-height: 1.75; color: #9fe1cb; margin: 0 0 1.5rem; opacity: 0.85;">ClaritechIO helps network operators build the standardized energy data foundation that drives real efficiency gains and clears the path for AI-driven operations. Let's talk about what that looks like for your network.</p>
</div>
            ]]>
        </content>
    </entry>
    <entry>
        <title>Energy Digital Twins</title>
        <author>
            <name>Jon Baars</name>
        </author>
        <link href="https://www.claritech.io/energy-digital-twins/"/>
        <id>https://www.claritech.io/energy-digital-twins/</id>
        <media:content url="https://www.claritech.io/media/posts/37/Telecom-sites-remote-monitoring-1.png" medium="image" />
            <category term="All Articles"/>

        <updated>2026-02-05T15:15:04-08:00</updated>
            <summary type="html">
                <![CDATA[
                        <img src="https://www.claritech.io/media/posts/37/Telecom-sites-remote-monitoring-1.png" alt="" />
                    Beyond Today's Digital Twins Digital twins are being widely considered for telecom infrastructure, including for radio network modeling and optimization, as well as for managing tower infrastructure and physical assets. That work is important, but this post is about energy. New methods are enabling visibility&hellip;
                ]]>
            </summary>
        <content type="html">
            <![CDATA[
                    <p><img src="https://www.claritech.io/media/posts/37/Telecom-sites-remote-monitoring-1.png" class="type:primaryImage" alt="" /></p>
                <h2>Beyond Today's Digital Twins</h2>
<p>Digital twins are being widely considered for telecom infrastructure, including for <span class="s1"><strong>radio network modeling and optimization</strong></span>, as well as for <strong>managing tower infrastructure and physical assets</strong>. </p>
<p class="p3">That work is important, but this post is about <span class="s2"><strong>energy.</strong></span></p>
<p>New methods are enabling visibility into energy behavior across live telecom networks that hasn't existed before.  The resulting energy data parallels and enhances the digital twin work described above.</p>
<h2><strong>An Energy Digital Twin</strong></h2>
<p class="p3">An energy digital twin promises a continuously synchronized view of how power is consumed across a network. In theory, it would explain <i>where</i>, <i>how, and why energy behaves</i> over time, enabling benchmarking, optimization, long-term efficiency gains, modelling, as well as even controlling managed energy systems.</p>
<blockquote>
<p>One highly desirable outcome of radio network modeling is <strong>FOR radio energy optimization</strong>, but <strong>measuring complete energy usage</strong> is a relative afterthought to the exact methods radio vendors are using to make their radios more energy efficient.   Additionally, even if energy usage is measured within a vendor's toolset, nobody is expecting Radio Vendor A to measure efficiency of Radio Vendor B's equipment, or vice versa.</p>
<p>In a tower infrastructure digital twin, if you have all your physical tower assets mapped along with other valuable data, why wouldn't you want to enhance the value of those systems by adding energy data to these models? </p>
<p>An energy digital twin is a natural addition and fit alongside other digital twins in the network.</p>
</blockquote>
<p class="p3">An energy digital twin is a compelling vision that has been constrained by technological and business-related issues, but <strong>new methods enable MOST of the benefits of an energy digital twin today.</strong></p>
<h2>Energy is Different</h2>
<p class="p3">Energy doesn't behave like a physical asset.  </p>
<p class="p3">Across a wide range of telecom network remote cell tower sites and operator-owned data centers:</p>
<ul>
<li>
<p class="p1">Energy changes constantly, so telemetry data must be gathered constantly.</p>
</li>
<li>Energy hardware assets themselves are often "smart" and create needed data about themselves.</li>
<li><strong>Brownfield networks contain many different vendor's energy equipment that don't adhere to standards on how telemetry data is reported</strong>.</li>
<li>It isn't cost-effective to replace or add hardware or software to try and solve the problem.</li>
<li>Benefits can only be realized if energy data is observed over time.</li>
<li>AI usage is imminent.</li>
</ul>
<p class="p3">Due to these factors, energy data today is either:</p>
<ul>
<li>Limited to minimal and infrequent alarm/fault data (not telemetry data), or</li>
<li>Locked inside vendor-specific observation tools.   </li>
</ul>
<p>While other digital twins are maturing, the <strong>possibility of </strong><span class="s2"><strong>energy digital twins has barely been considered</strong></span>.</p>
<h2><strong>What Has Changed?</strong></h2>
<p class="p3">Advances in data streaming and open-source time-series platforms have changed what is possible.  These tools are rapidly transforming ALL industries as their adoption is a natural first step to AI adoption.   In many cases these tools are being applied first to legacy data problems.  "How do we convert existing data and existing processes into something workable within real-time data streaming architecture."   </p>
<p>What isn't as visible, is how <strong>real-time data streaming tools are enabling</strong> <strong>NEW data that hasn't existed before and is creating entirely new applications</strong>.   </p>
<p>It is now feasible within a telecom network to:</p>
<ul>
<li>Collect <span class="s2">high volumes of energy telemetry continuously.</span></li>
<li>Write proprietary vendor management interfaces to new vendor-neutral standards by equipment class (DC plant, batteries, generators, meters, etc).</li>
<li>Move and retain this new data efficiently.</li>
<li>Accomplish a project at a lower cost and better end result than proprietary legacy solutions.</li>
</ul>
<p>Instead of occasional manual energy audits or relatively small amounts of energy faults, operators can now observe <span class="s2"><strong>energy as a living system</strong></span>, minute by minute, across thousands of sites.  <strong>This scale of data hasn't existed before for telecom operators before these new tools have made it possible.</strong>   Our use of the tools has been evolving over years as the tools have improved.  As opposed to gathering relatively tiny amounts of energy related faults, we will gather:</p>
<ul>
<li><strong>30K+ records a minute in a medium-sized telecom data center.</strong>   15B+ records a year per facility.</li>
<li><strong>50-100 records per 1-3 minutes, per cell site location.</strong>   1000 sites at 75 records per year on one minute intervals is close to 40B records.</li>
</ul>
<p class="p3">This shift does not create a digital twin on its own, but it makes something that never existed before possible: <span class="s2"><strong>continuous visibility into real energy behavior at network scale</strong></span>.</p>
<h2><strong>ClaritechIO’s role</strong></h2>
<p class="p3">This isn't by definition a full energy digital twin of a telecom network.  We believe that the data aquisition method we are describing is something that will <strong>eventually be adopted by all telecom networks</strong>, and we don't want to slow this adoption by over-promising anything that isn't currently possible.  </p>
<p class="p3">What IS possible now is to build a cost-effective <span class="s2"><strong>data pipeline foundation</strong></span> an energy digital twin would require, including:</p>
<p class="p3"><span class="s2"><strong>Vendor-neutral energy telemetry pipeline infrastructure </strong></span>across live telecom networks and operator data centers.</p>
<p class="p3"><span class="s2"><strong>High volumes of standardized data by equipment class</strong></span>, not by vendor—rectifiers, batteries, cooling, generators, AC and DC meters, PDU's - as well as standardizing data from many IoT/RMS/RTU/AC meters/fuel measurement devices from past, frequently partially completed, energy measurement projects.   </p>
<p><strong>Ongoing and historical data that supports "digital twin-like" abilities</strong>, providing an initial "living" model of energy usage in a network and being fully compatible with future digital twin ambitions.</p>
<p><strong>At a lower cost</strong> than other methods like IoT/RTU/RMS/AC metering systems, and creating enough direct energy savings to <strong>immediately pay for themselves</strong>.</p>
<p>ClaritechIO provides standardized energy data as a service to telecom operators as we believe this provides the maximum benefit to users and gives the most flexibility to users to choose how to best use this new data.</p>
<h2 class="p1"><strong>Conclusion - Data Foundation for Energy Digital Twins</strong></h2>
<p class="p1">Energy data is meaningful when observed <span class="s1"><strong>continuously over time</strong></span>. Until recently, this was not feasible across live telecom networks.  Accurate, standardized energy data is essentially "neutral".   It could be used directly by telecom operators, by other vendors, or by anyone who might be able to create something valuable from it.  We are open to helping anyone understand this method better.</p>
<p class="p1">Modern data streaming now makes <span class="s1"><strong>continuous, vendor-neutral energy telemetry</strong></span> possible at network scale. This is not an energy digital twin—but it is the foundation one requires.</p>
<p> </p>
            ]]>
        </content>
    </entry>
    <entry>
        <title>Open Hardware, Meet Open Data </title>
        <author>
            <name>Jon Baars</name>
        </author>
        <link href="https://www.claritech.io/open-hardware-meet-open-data-data-center-energy-efficiency-in-the-era-of-the-open-compute-project-and-data-streaming-technology/"/>
        <id>https://www.claritech.io/open-hardware-meet-open-data-data-center-energy-efficiency-in-the-era-of-the-open-compute-project-and-data-streaming-technology/</id>
        <media:content url="https://www.claritech.io/media/posts/35/Datacenter-monitoring.png" medium="image" />
            <category term="All Articles"/>

        <updated>2025-10-13T10:23:35-07:00</updated>
            <summary type="html">
                <![CDATA[
                        <img src="https://www.claritech.io/media/posts/35/Datacenter-monitoring.png" alt="" />
                    Data Center Energy Efficiency in Open Networks The Open Compute Project (OCP) transforms how the data center industry thinks about hardware openness. OCP open hardware standards enable lower costs, vendor flexibility, energy efficiency best practices, scalability, modularity, and more. The logic is clear. We're convinced&hellip;
                ]]>
            </summary>
        <content type="html">
            <![CDATA[
                    <p><img src="https://www.claritech.io/media/posts/35/Datacenter-monitoring.png" class="type:primaryImage" alt="" /></p>
                <h3><strong>Data Center Energy Efficiency in Open Networks</strong></h3>
<p class="p3">The <span class="s2"><strong>Open Compute Project (OCP)</strong></span> transforms how the data center industry thinks about <span class="s2">hardware openness.<strong> </strong></span> OCP open hardware standards enable lower costs, vendor flexibility, energy efficiency best practices, scalability, modularity, and more.  The logic is clear.   </p>
<p>We're convinced that there is a similar <strong>parallel data track</strong> that should be paired with these open hardware standards for <strong>managing data center energy usage</strong>.   We have multiple production examples where we are using modern <strong>open-source data streaming</strong> tools to gather and standardize <strong>30k+ energy metrics per minute</strong> in data center environments across a wide-range of equipments classes and vendors.   Over a billion records per month.<br><br>Similar to the logic behind OCP standards, the data standardization methods we're employing are decoupled from specific hardware and software vendors.   These standards can be used in any current modern data center design you have, but also be applied retroactively to any past designs you have as well, standardizing data across all your infrastructure.  <br><br>The data, by itself, has a lot of value.   You can accumulate billions of telemetry points using open-source data streaming tools that are low risk, can be layered on top of all your existing processes, and are very cost-effective. </p>
<p class="p3"><span style="font-family: var(--editor-font-family); font-size: inherit;">O</span><span style="font-family: var(--editor-font-family); font-size: inherit;">pen-source data streaming and monitoring</span><span class="s3" style="color: var(--text-primary-color); font-family: var(--editor-font-family); font-size: inherit; font-weight: var(--font-weight-normal);"> tools </span>help operators turn raw hardware telemetry into standardized, real-time data streams — ready for analytics, billing, or AI.</p>
<p class="p3">This approach allows you to:</p>
<ul>
<li>
<p class="p1">⚙️ Integrate multi-vendor hardware without lock-in</p>
</li>
<li>
<p class="p1">⚡ Build unified energy dashboards and billing systems</p>
</li>
<li>
<p class="p1">♻️ Drive sustainability and ESG reporting from actual vs. estimated data</p>
</li>
<li>
<p class="p1">🤖 Build your own data sets to prepare for AI-driven optimization </p>
</li>
</ul>
<p>If you’re part of the OCP community working on power, telemetry, or energy efficiency initiatives in data centers, we’d love to compare notes.    We'd really like to match our method with the telemetry output of GPU's.   If you have a means of testing this, let's talk!<br><br>The benefits of these open-source methods are listed <a href="https://www.claritech.io/how-focus-benefits-your-network-bottom-line-and-the-planet/">here</a>.</p>
<p class="p3">#OCP #OpenCompute #DataStreaming #DataCenters #EnergyEfficiency #OCPSummit25</p>
            ]]>
        </content>
    </entry>
    <entry>
        <title>GSMA Intelligence Report</title>
        <author>
            <name>claritech.io</name>
        </author>
        <link href="https://www.claritech.io/gsma-intelligence-network-energy-efficiency/"/>
        <id>https://www.claritech.io/gsma-intelligence-network-energy-efficiency/</id>
        <media:content url="https://www.claritech.io/media/posts/34/Screenshot-2025-10-01-at-5.55.17-AM.png" medium="image" />
            <category term="All Articles"/>

        <updated>2025-10-01T06:38:58-07:00</updated>
            <summary type="html">
                <![CDATA[
                        <img src="https://www.claritech.io/media/posts/34/Screenshot-2025-10-01-at-5.55.17-AM.png" alt="" />
                    New report from GSMA features Claritech.io and talks about the three most common methods operators are pursuing to improve energy efficiency in their networks. In-House Tools: Many larger operators are aware of benefits of new data streaming tools that are available, but trying to do&hellip;
                ]]>
            </summary>
        <content type="html">
            <![CDATA[
                    <p><img src="https://www.claritech.io/media/posts/34/Screenshot-2025-10-01-at-5.55.17-AM.png" class="type:primaryImage" alt="" /></p>
                <p>New <a href="https://www.gsmaintelligence.com/research/5g-next-optimising-energy-in-the-age-of-network-complexity-via-integrated-dashboards" target="_blank" rel="noopener noreferrer">report</a> from <strong>GSMA</strong> <strong>features Claritech.io</strong> and talks about the three most common methods operators are pursuing to improve energy efficiency in their networks.</p>
<ul>
<li><span class="s1"><strong>Vendor Tools:</strong></span>  These are the tools most operators are most familiar with.  The hardware vendors who are already within your network offer tools that can improve energy and operational efficiency for their own equipment, but almost always suffer from large amounts of data siloing.    We wrote about the impact of these silos in detail <a href="https://www.claritech.io/vendor-agnostic-network-energy-solutions/" target="_blank" rel="noopener noreferrer">here</a>.   Some software tools are available to manage energy across different vendor hardware, but this software is itself a new data silo.</li>
<li>
<p class="p1"><span class="s1"><strong>In-House Tools:</strong></span>  Many larger operators are aware of benefits of new data streaming tools that are available, but trying to do this type of work in-house involves a great deal of trial and error and usually involves expertise in both power-related issues and the data tools themselves - a rare skill set.  Most in-house efforts we've seen have been a work in progress at best.</p>
</li>
<li>
<p class="p1"><span class="s1"><strong>Vendor Agnostic Data Streaming Tools:</strong></span>  New data streaming technology allows for gathering and standardizing data across all your current, existing power and cooling infrastructure.    We are strong believers in this newest method, and you can find out more about our reasoning throughout our website.   We've been constantly evolving our use of these tools for years and have many examples we can show of how this works on real networks.</p>
</li>
</ul>
<p>Have a look at the rest of our website for much more on this, or contact us at <a href="mailto:sales@claritech.io">sales@claritech.io</a> if you'd like to see live examples.</p>
            ]]>
        </content>
    </entry>
    <entry>
        <title>How To Measure Energy Efficiency In Your Data Center </title>
        <author>
            <name>Jon Baars</name>
        </author>
        <link href="https://www.claritech.io/how-data-standardization-improves-your-data-center/"/>
        <id>https://www.claritech.io/how-data-standardization-improves-your-data-center/</id>
        <media:content url="https://www.claritech.io/media/posts/33/Untitled-design-6.png" medium="image" />
            <category term="All Articles"/>

        <updated>2025-09-15T08:42:09-07:00</updated>
            <summary type="html">
                <![CDATA[
                        <img src="https://www.claritech.io/media/posts/33/Untitled-design-6.png" alt="" />
                    Why a Data-First Strategy Matters Standardized energy data across all classes and makes of equipment in your data center is the key to modern data-center energy management. While data centers may have fewer silos than large telecom networks (as described in our paper Vendor Agnostic&hellip;
                ]]>
            </summary>
        <content type="html">
            <![CDATA[
                    <p><img src="https://www.claritech.io/media/posts/33/Untitled-design-6.png" class="type:primaryImage" alt="" /></p>
                <div class="post-hero">
<h3 class="align-center"><strong>Why a Data-First Strategy Matters</strong></h3>
<p class="lead">Standardized energy data across all classes and makes of equipment in your data center is the key to modern data-center energy management.</p>
<h3 class="align-center">Introduction</h3>
<p>While data centers may have fewer silos than large telecom networks (as described in our paper <i style="color: var(--text-primary-color); font-family: var(--editor-font-family); font-size: inherit; font-weight: var(--font-weight-normal);"><a href="https://www.claritech.io/vendor-agnostic-network-energy-solutions/" target="_blank" rel="noopener noreferrer">Vendor Agnostic Energy Efficiency</a></i><span style="color: var(--text-primary-color); font-family: var(--editor-font-family); font-size: inherit; font-weight: var(--font-weight-normal);">), the underlying problem is the same: fragmented systems by equipment brand and equipment class create <strong>data silos</strong> that prevent you from viewing and optimizing your full infrastructure.  The solution is the same too.  New open-source data streaming technology that is being implemented across every industry.</span></p>
</div>
<p>A core function of most data centers is to maximize <strong>use of physical space, increase power density, and minimize cooling cost</strong> — either to maximize the efficiency of internal operations or to sell capacity as competitively as possible. With growing demand from AI workloads, energy capacity and efficiency are quickly becoming critical bottlenecks for today’s data-center business models.</p>
<h3 class="section align-center">How Capacity, Energy Efficiency, and Billing Work Together</h3>
<div class="callout">
<p><strong>Capacity planning</strong> sits at the heart of reliable, profitable operations. To get it right, operators need accurate visibility into <strong>rack space, energy use, cooling efficiency, and backup power systems</strong>. Without unified data, efficiency gains are harder to achieve and risks are harder to mitigate.   Better measurements of energy data allow for better capacity planning.   Integrating data streams from actual power usage by device can be integrated with data streams reflecting energy sources and costs, enabling a better way of competing for and <strong>billing</strong> data center customers.    Adding billing data to the power consumption data of your equipment also gives direct insight into how data center power performance is affecting your energy spending. </p>
</div>
<h3 class="section align-center">A Data-First Approach</h3>
<p>At ClaritechIO, we’ve seen how <strong>data streaming</strong> and a <strong>data-first strategy</strong> transform data-center management. Accurate, standardized data is the <i>smallest common denominator</i> of network management — the foundation everything else depends on.</p>
<p>Traditionally, improving data-center network and energy management has meant one of two things:</p>
<ul class="bullets">
<li><strong>Replacing hardware</strong> — swapping cooling systems, meters, rectifiers, generators, PDUs, or other equipment for newer models with “better” and more consistent management interfaces. This often leads to <strong>vendor lock-in</strong> simply to maintain consistency.</li>
<li><strong>Replacing software</strong> — adopting a new platform such as Data Center Infrastructure Management (DCIM), Building Management Software (BMS), or Element Management Software (EMS).</li>
</ul>
<p><strong>Standardized data is better.</strong> It doesn’t require replacing existing hardware or committing to new back-end software. Instead, it generates clean, flexible data streams that can be used across your organization.</p>
<h3 class="section align-center">Why Standardized Data Wins</h3>
<ul class="benefits">
<li><strong>Lower risk, lower cost, faster results.</strong> Create the standardized stream first — avoid big hardware/software changes and the inevitable data standardization work afterward.    There is also nothing stopping you from layering standardized data streaming on top of other tools in your network.</li>
<li><strong>Open-source flexibility.</strong> Stream into <a href="https://grafana.com" target="_blank" rel="noopener noreferrer"><strong>Grafana</strong></a> (observability with built-in AI/ML), your existing tools, or directly into your broader data infrastructure via <strong><a href="https://kafka.apache.org/" target="_blank" rel="noopener noreferrer">Apache Kafka</a>,</strong> which is also a great method for taking near real-time monitoring data into new AI tools.  </li>
<li><strong>Pilot first, scale fast, minimal disruption.</strong> Start small, prove the value, and expand as an overlay without disrupting current processes.</li>
</ul>
<h3 class="section align-center">Key Benefits for Data Centers</h3>
<ul class="benefits">
<li><strong>Integrated billing.</strong> Tie energy data directly into financial workflows.</li>
<li><span style="color: #02192b;"><strong>Unsilo Data.   </strong>View unlike items together.   Power, cooling, GPU telemetry, billing in new views to support business decision-making. </span></li>
<li><strong>Vendor-agnostic design.</strong> Mix and match equipment vendors without creating new silos.</li>
<li><strong>Clear visibility.</strong> Real-time dashboards for energy, cooling, and backup systems as well as creation of new metrics like power usage effectiveness (PUE). </li>
<li><strong>Smarter capacity planning.</strong> Use standardized data to forecast and optimize.</li>
</ul>
<figure><figure class="post__image"><img loading="lazy"  src="https://www.claritech.io/media/posts/33/small-DC-single-dashboard.png" alt="" width="3795" height="1780" sizes="(min-width: 37.5em) 1600px, 88vw" srcset="https://www.claritech.io/media/posts/33/responsive/small-DC-single-dashboard-xs.png 640w ,https://www.claritech.io/media/posts/33/responsive/small-DC-single-dashboard-sm.png 768w ,https://www.claritech.io/media/posts/33/responsive/small-DC-single-dashboard-md.png 1024w ,https://www.claritech.io/media/posts/33/responsive/small-DC-single-dashboard-lg.png 1366w ,https://www.claritech.io/media/posts/33/responsive/small-DC-single-dashboard-xl.png 1600w"></figure>
<figcaption>Example 1 - Small ~250kW Data Center w/PUE</figcaption>
</figure>
<figure><figure class="post__image"><img loading="lazy"  src="https://www.claritech.io/media/posts/33/PDU-monitoring-Feb-2025.png" alt="PDU Density" width="1885" height="1892" sizes="(min-width: 37.5em) 1600px, 88vw" srcset="https://www.claritech.io/media/posts/33/responsive/PDU-monitoring-Feb-2025-xs.png 640w ,https://www.claritech.io/media/posts/33/responsive/PDU-monitoring-Feb-2025-sm.png 768w ,https://www.claritech.io/media/posts/33/responsive/PDU-monitoring-Feb-2025-md.png 1024w ,https://www.claritech.io/media/posts/33/responsive/PDU-monitoring-Feb-2025-lg.png 1366w ,https://www.claritech.io/media/posts/33/responsive/PDU-monitoring-Feb-2025-xl.png 1600w"></figure>
<figcaption>Example 2 - Power Density At PDU Level</figcaption>
</figure>
<figure><figure class="post__image"><img loading="lazy"  src="https://www.claritech.io/media/posts/33/CRAC-monitoring-Feb-2025.png" alt="" width="3782" height="1560" sizes="(min-width: 37.5em) 1600px, 88vw" srcset="https://www.claritech.io/media/posts/33/responsive/CRAC-monitoring-Feb-2025-xs.png 640w ,https://www.claritech.io/media/posts/33/responsive/CRAC-monitoring-Feb-2025-sm.png 768w ,https://www.claritech.io/media/posts/33/responsive/CRAC-monitoring-Feb-2025-md.png 1024w ,https://www.claritech.io/media/posts/33/responsive/CRAC-monitoring-Feb-2025-lg.png 1366w ,https://www.claritech.io/media/posts/33/responsive/CRAC-monitoring-Feb-2025-xl.png 1600w"></figure>
<figcaption>Example 3 - Cooling Capacity</figcaption>
</figure>
<h3 class="section align-center">Closing Thought</h3>
<p class="p1">Energy efficiency has always been a goal in data centers, but the same barriers — especially <strong>data silos</strong> — have limited progress. Modern data-streaming technology is  simply a better solution and it is being adopted across most industries to support AI.  These tools aren’t just better than legacy approaches; their arrival in all organizations now seems inevitable.  We expect <strong>data-streaming technology will be everywhere</strong> in the future, and early adopters will benefit the most.    We really view this as a strategic imperative and that NOT factoring in the arrival of tools proposed here is a major strategic mis-step.   </p>
<p>The good news is that network energy efficiency measurement at a granular level has largely not been attempted to this point, largely due to the fact that results from existing tools have been mixed (again, data silos are largely to blame).    A major challenge that data streaming is solving in every organization is unsiloing data from legacy systems.  <strong>Legacy systems are are not something we are really burdened with here</strong>.  Most people have not gathered large amounts of energy and energy-related data about their own networks.  The energy efficiency ability we describe here can simply be added on top of your current network as a valuable new service in your network.<br><br>What we've accomplished in real projects using these tools is a complete leap ahead of solutions we ourselves were delivering using proprietary tools just a few years ago.   We have multiple data center examples where we are gathering over <strong>20k+ telemetry points per minute</strong> and the upfront cost is less than older systems that only provided you basic alarming.  You can probably sense that we are very excited about what these tools open up as possibilities, not just in the form of immediate delivery of dashboards, but later as we begin to integrate the data streams created here with other data.   These systems can create new data themselves.  We've created new SLA metrics in some cases.  This data is very <strong>compatible with new AI tools</strong>.   We're interested to match the energy data we're creating with energy telemetry directly from GPU's.  Other applications that are opening up relate to billing.   A competitive advantage where you deliver much more precise and automated energy bills as part of your data center services.  Dashboards are just the beginning.</p>
<p><span style="color: var(--text-primary-color); font-family: var(--editor-font-family); font-size: inherit; font-weight: var(--font-weight-normal);">Let us show you how this works in real networks.  We'd be happy to show live examples and answer any questions you have so you can make up your own mind.   Just drop us a line!  -  sales@claritech.io</span></p>
            ]]>
        </content>
    </entry>
</feed>